A Poll asks one question with a list of options. Participants tick an option on their phone and press Submit, and the chart on the big screen grows with every vote. Use it to check opinions, warm up a session or let the room choose what comes next.
Set up a poll
- 1
Add the slide
In the editor, click + New Slide. In Choose Slide Type, open the Interactive tab and pick Poll.
- 2
Write the question
Type it in the question field at the top of the Content tab. Click Add description for an extra line, or Add Question Image to show a picture.
- 3
Add the options
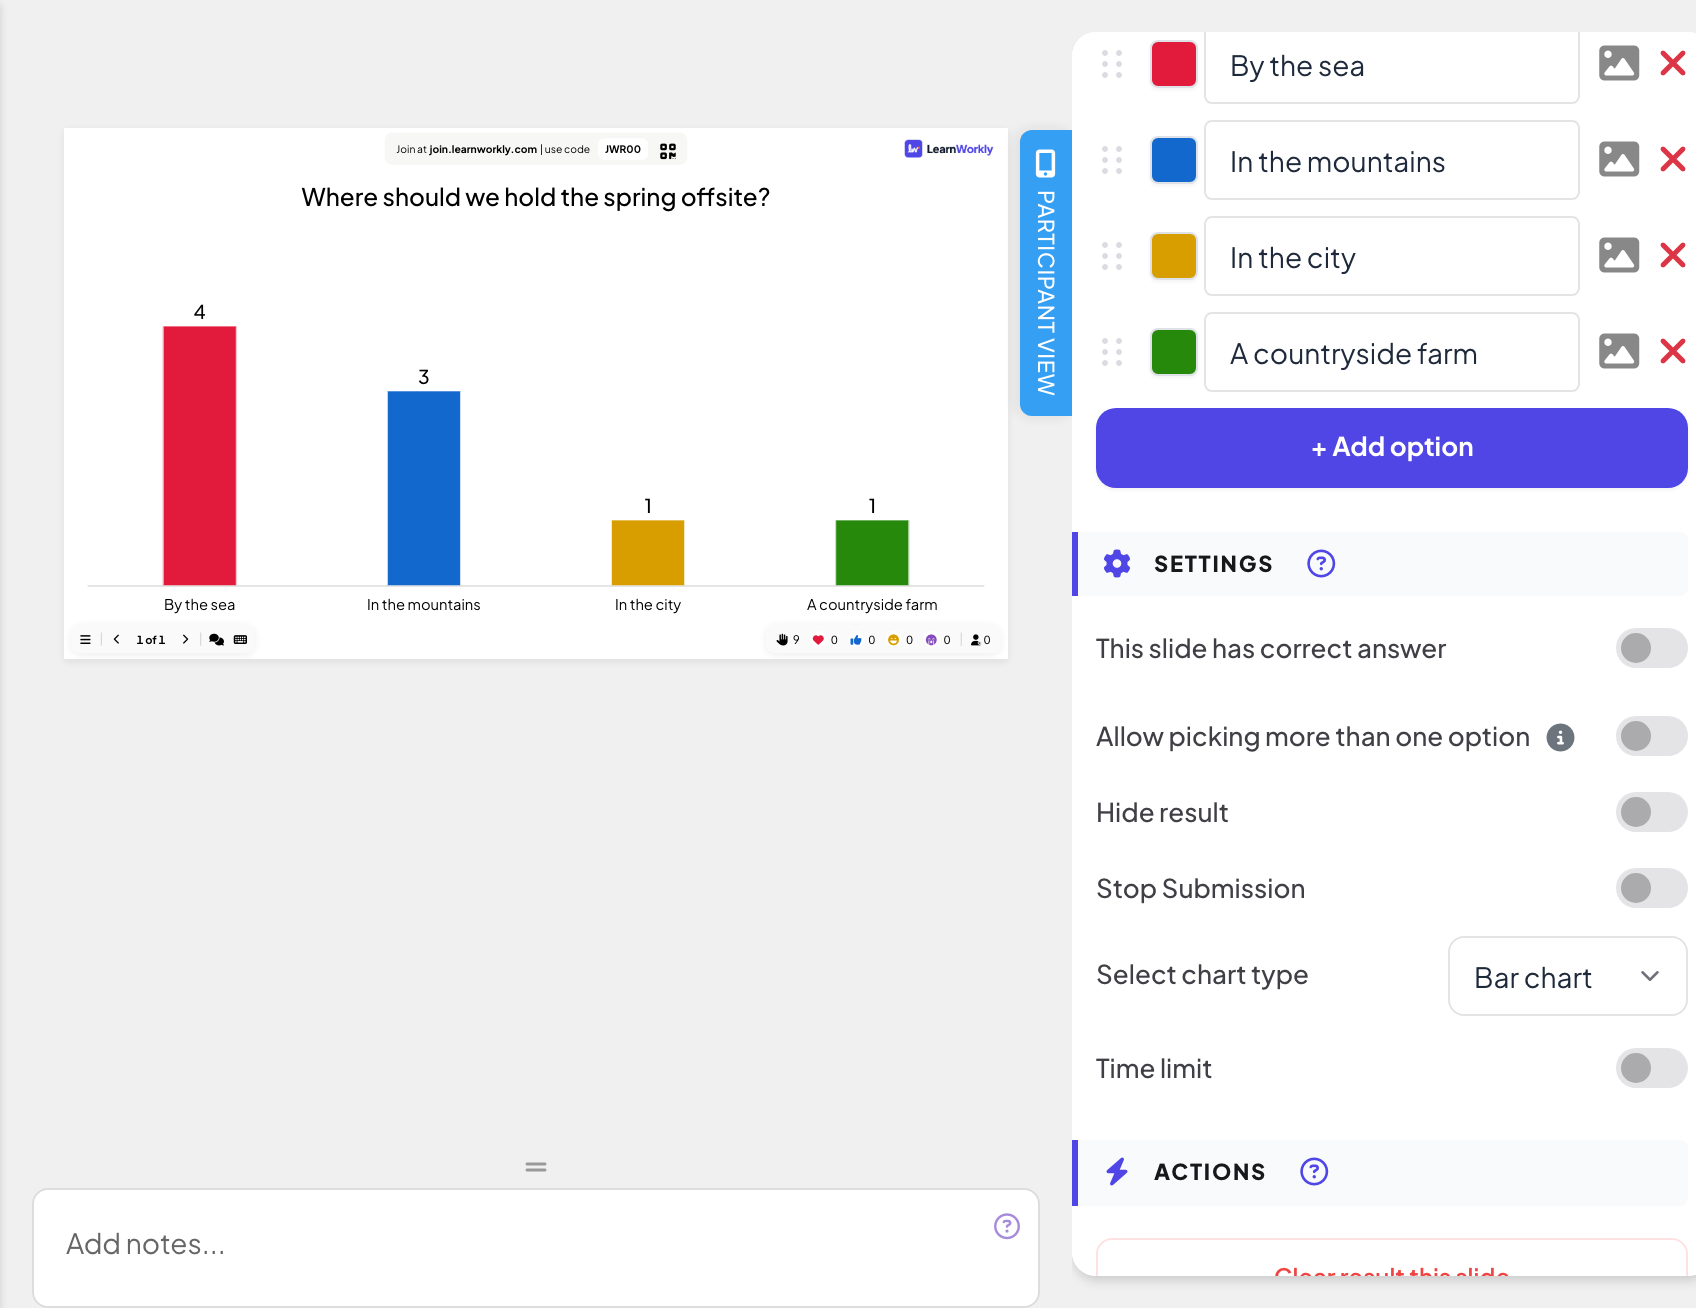
Under Options, type each answer and click + Add option for more, up to 9. The coloured square sets the colour of the bar, the picture icon adds an image and the cross removes the option. Drag the dots on the left to reorder.
- 4
Choose the settings
Under Settings, pick Bar chart or Pie chart in Select chart type and turn on any of the switches below.
Poll settings
- This slide has correct answer: tick the right option(s). The chart then shows a check mark next to correct options and a cross next to the others.
- Allow picking more than one option: participants can select several options before they submit. When the slide has a correct answer, this only applies if at least two options are marked correct.
- Hide result: votes are collected but the chart stays empty until you click Show result on the slide.
- Stop Submission: closes voting. Click Enable Submission on the slide to open it again.
- Time limit: a countdown runs on the slide; when it reaches zero, voting closes.
Run it live
- 1
Present the slide
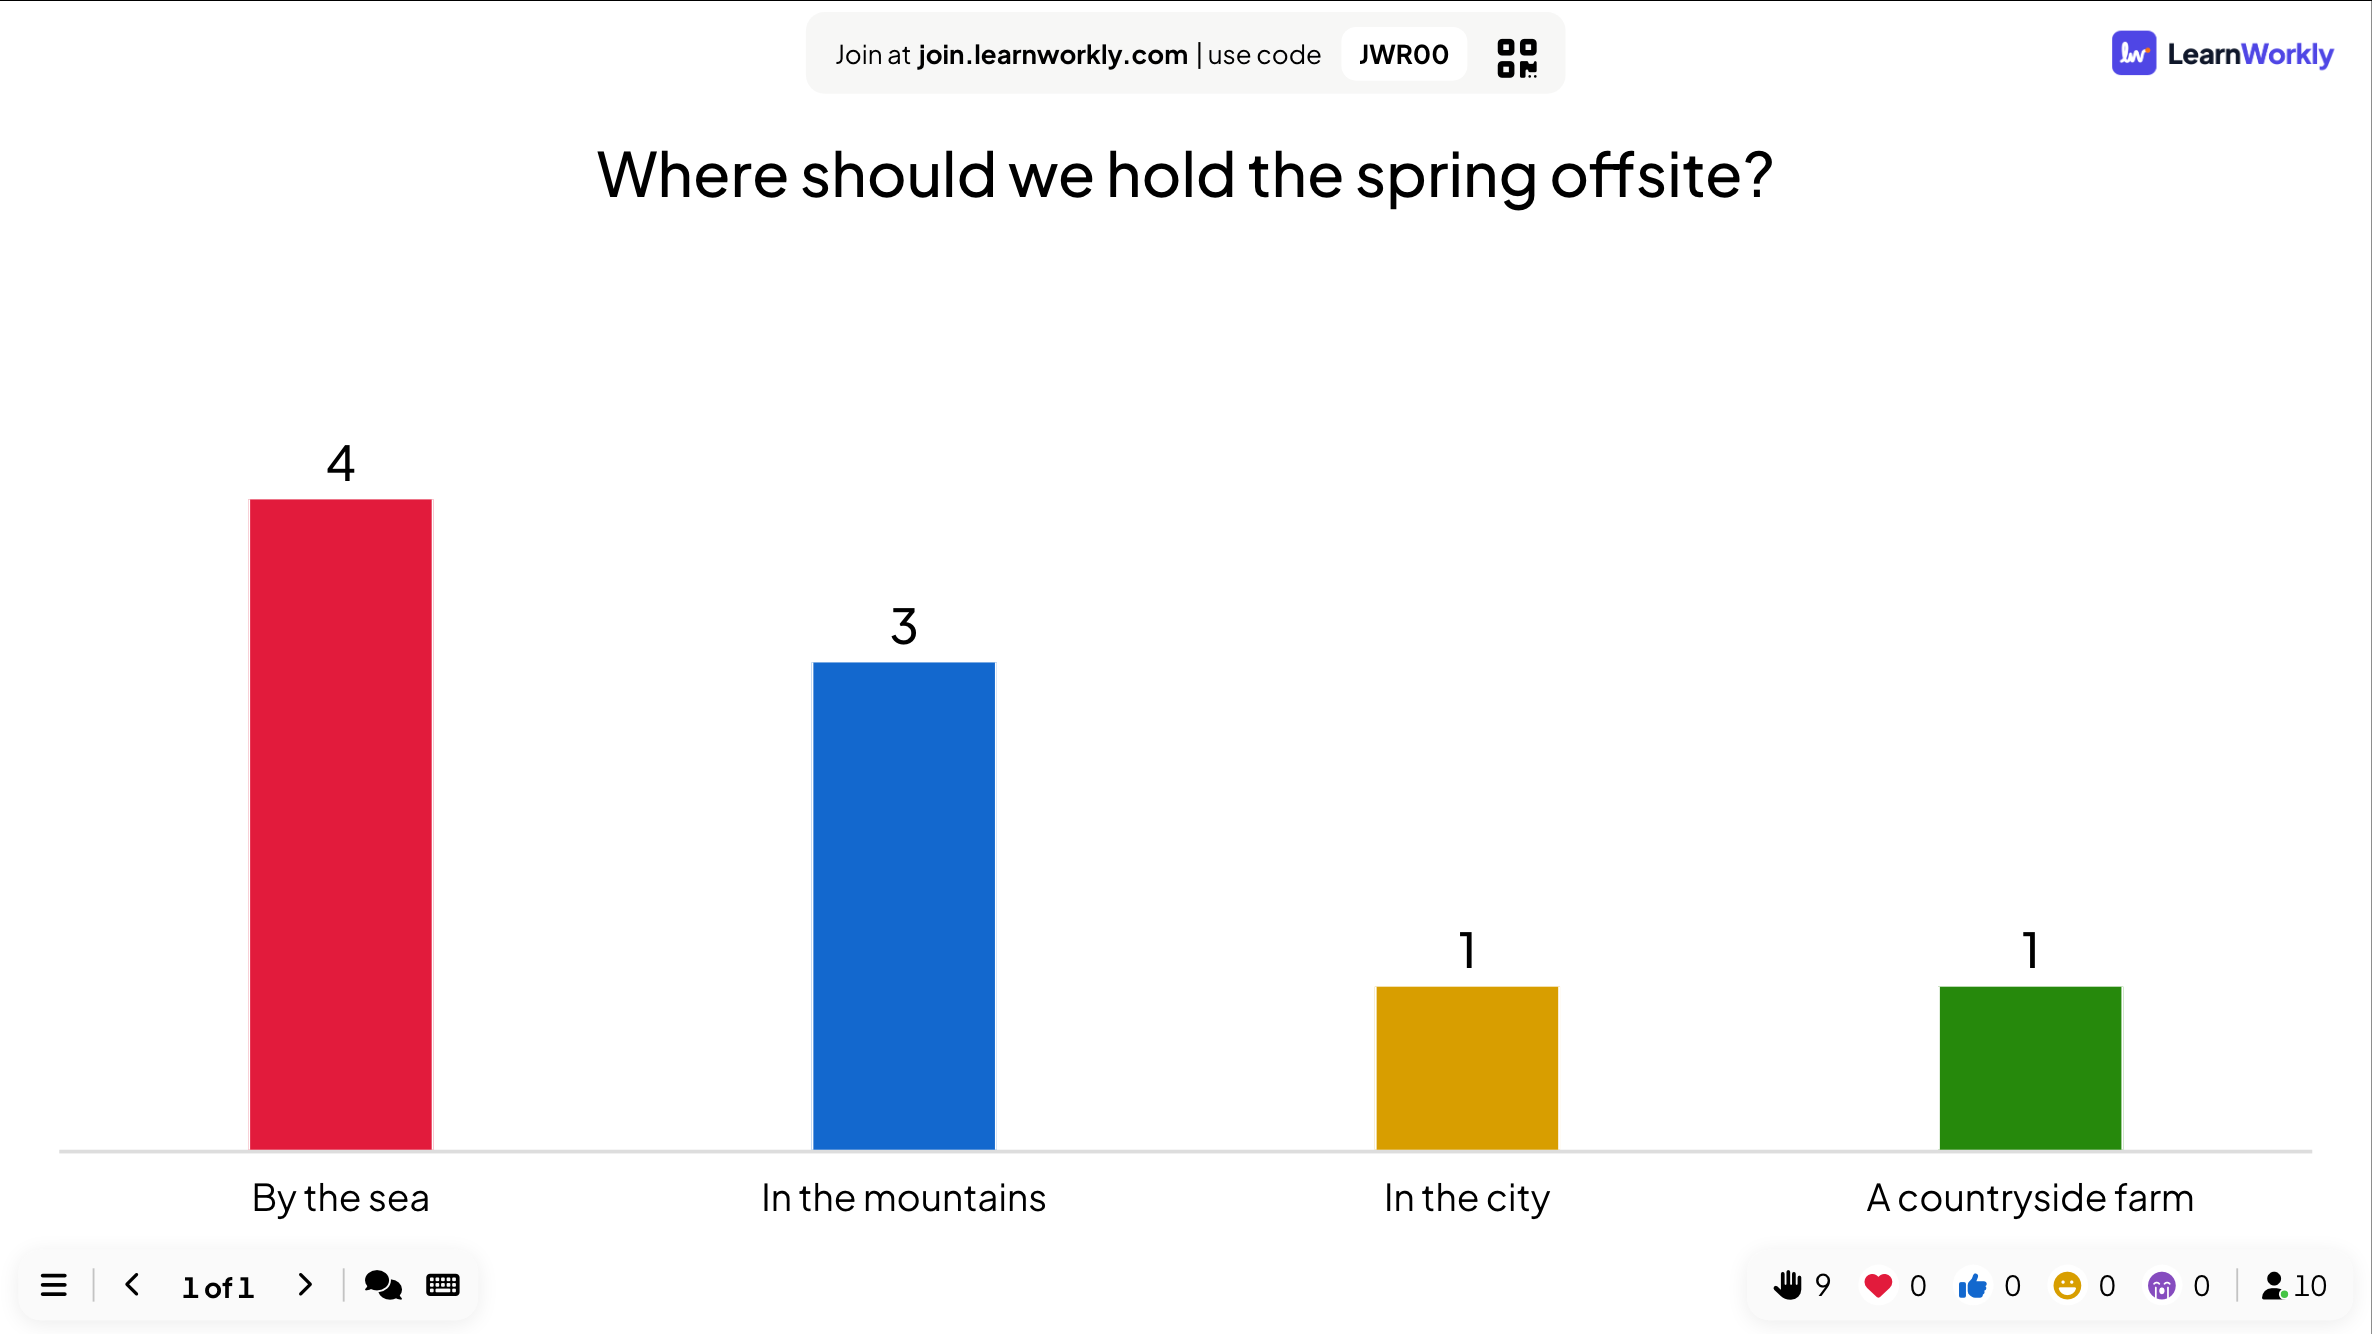
Click Present. People join at join.learnworkly.com with your code or the QR code, and the slide appears on their phones.
- 2
People vote
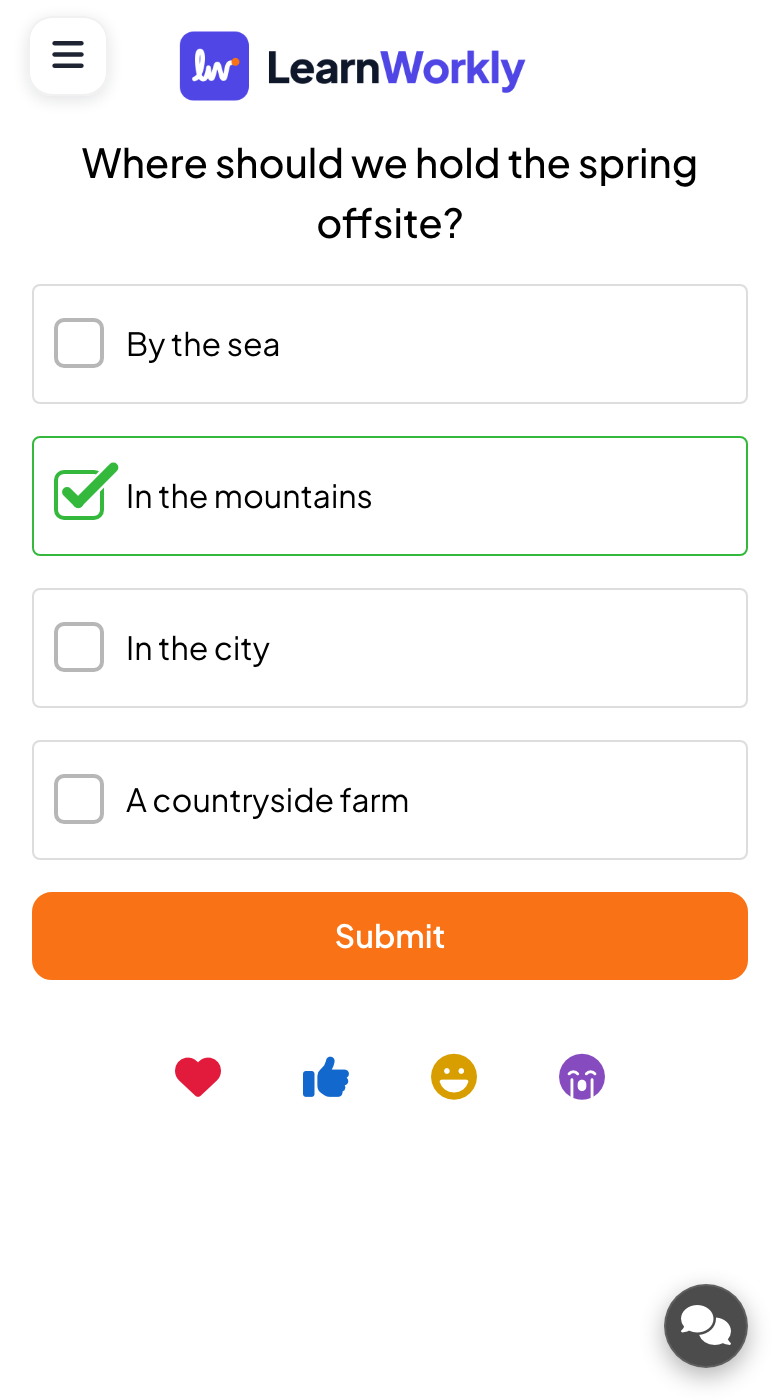
Each phone shows the options as tick boxes. Participants tick one (or several, if allowed) and press Submit. Their phone then shows Submitted.
- 3
Watch the chart
The bars grow as votes arrive, with the number of votes above each bar. On the bar chart, click a bar to switch between vote counts and percentages. If you added a question image, Show image and Hide image switch between the picture and the chart.
Results in the report
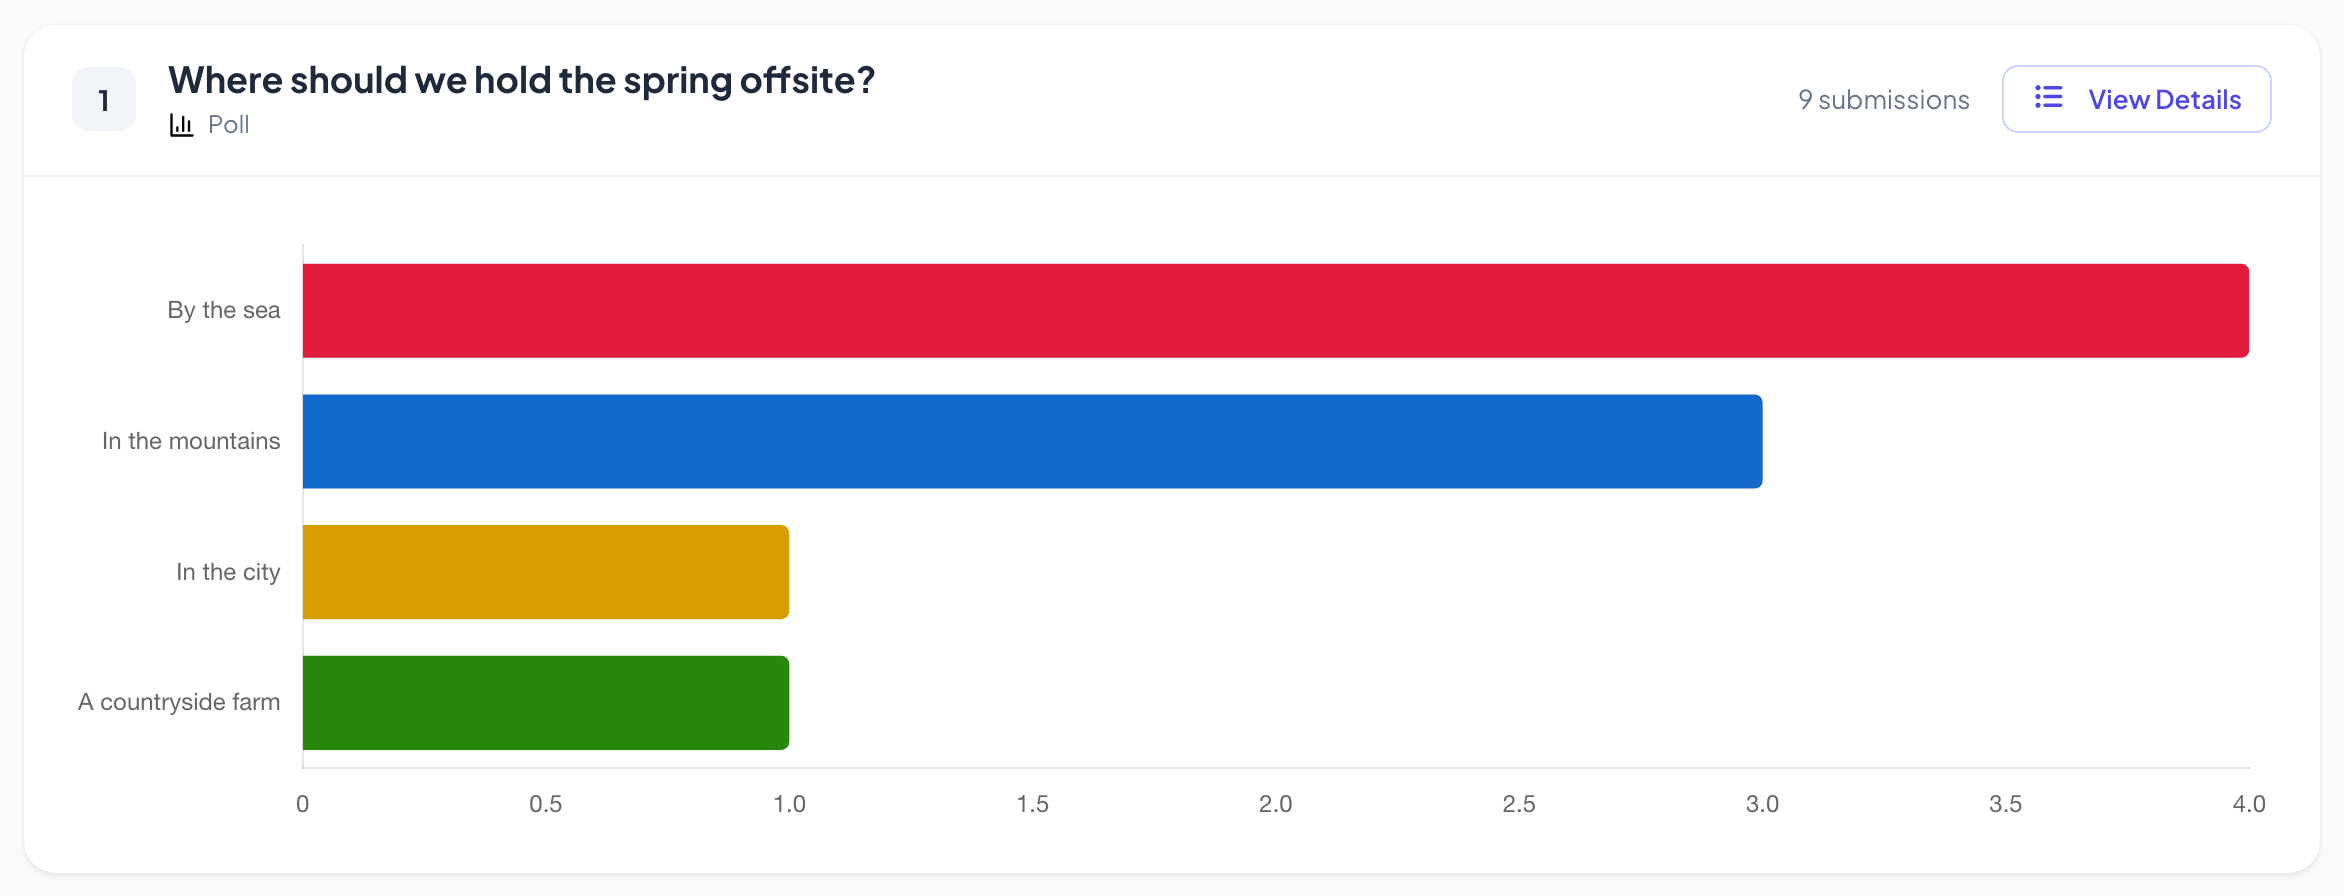
After the session, open the presentation’s report (the report button in the editor’s top bar, or Report in your presentation list) and go to Slide Results. See Read the report of a presentation. A poll shows a bar chart of the votes, the number of submissions and View Details with each answer.
Frequently asked questions
Can participants change their vote?
No. Once they press Submit, their phone shows Submitted and the vote is counted.
Are votes anonymous?
The chart on the big screen shows totals only, never names. The report’s View Details lists answers per participant, with a name only if they gave one.
The chart is empty but people have voted.
Hide result is probably on. Click Show result on the slide, or turn the setting off.
Can I run the same poll again with a new group?
Yes. To keep the earlier votes, click Clear all results in the top bar of the editor: they stay in the report as an earlier session. Clear result this slide under Actions in the Content tab deletes the votes of this slide only, and they are not in the report afterwards.
Last checked against the app on 17 November 2026.
Related articles
- Ranking: put options in order of preferenceParticipants drag options into their order of preference on their phones, and the big screen ranks the options by the combined result of the room.
- Select Answer: multiple-choice quiz questionsAsk a multiple-choice question with up to six options, mark the right answers, set the time and points, and play it live with a countdown and a reveal.
- Response settings for interactive slidesTurn on correct answers, hide results, stop submissions, allow several answers, set a time limit and clear results on polls, word clouds and other slides.