A 2x2 Grid analyses responses on two dimensions at once. Classic uses are effort versus impact, urgency versus importance, or confidence versus interest.
Set up a grid
- 1
Add the slide
In the editor, click + New Slide. In Choose Slide Type, open the Interactive tab and pick 2x2 Grid.
- 2
Write the question
For example "Rate each idea on effort and impact".
- 3
Add the items
Under Options, add each item to be plotted, up to 9.
- 4
Name the axes
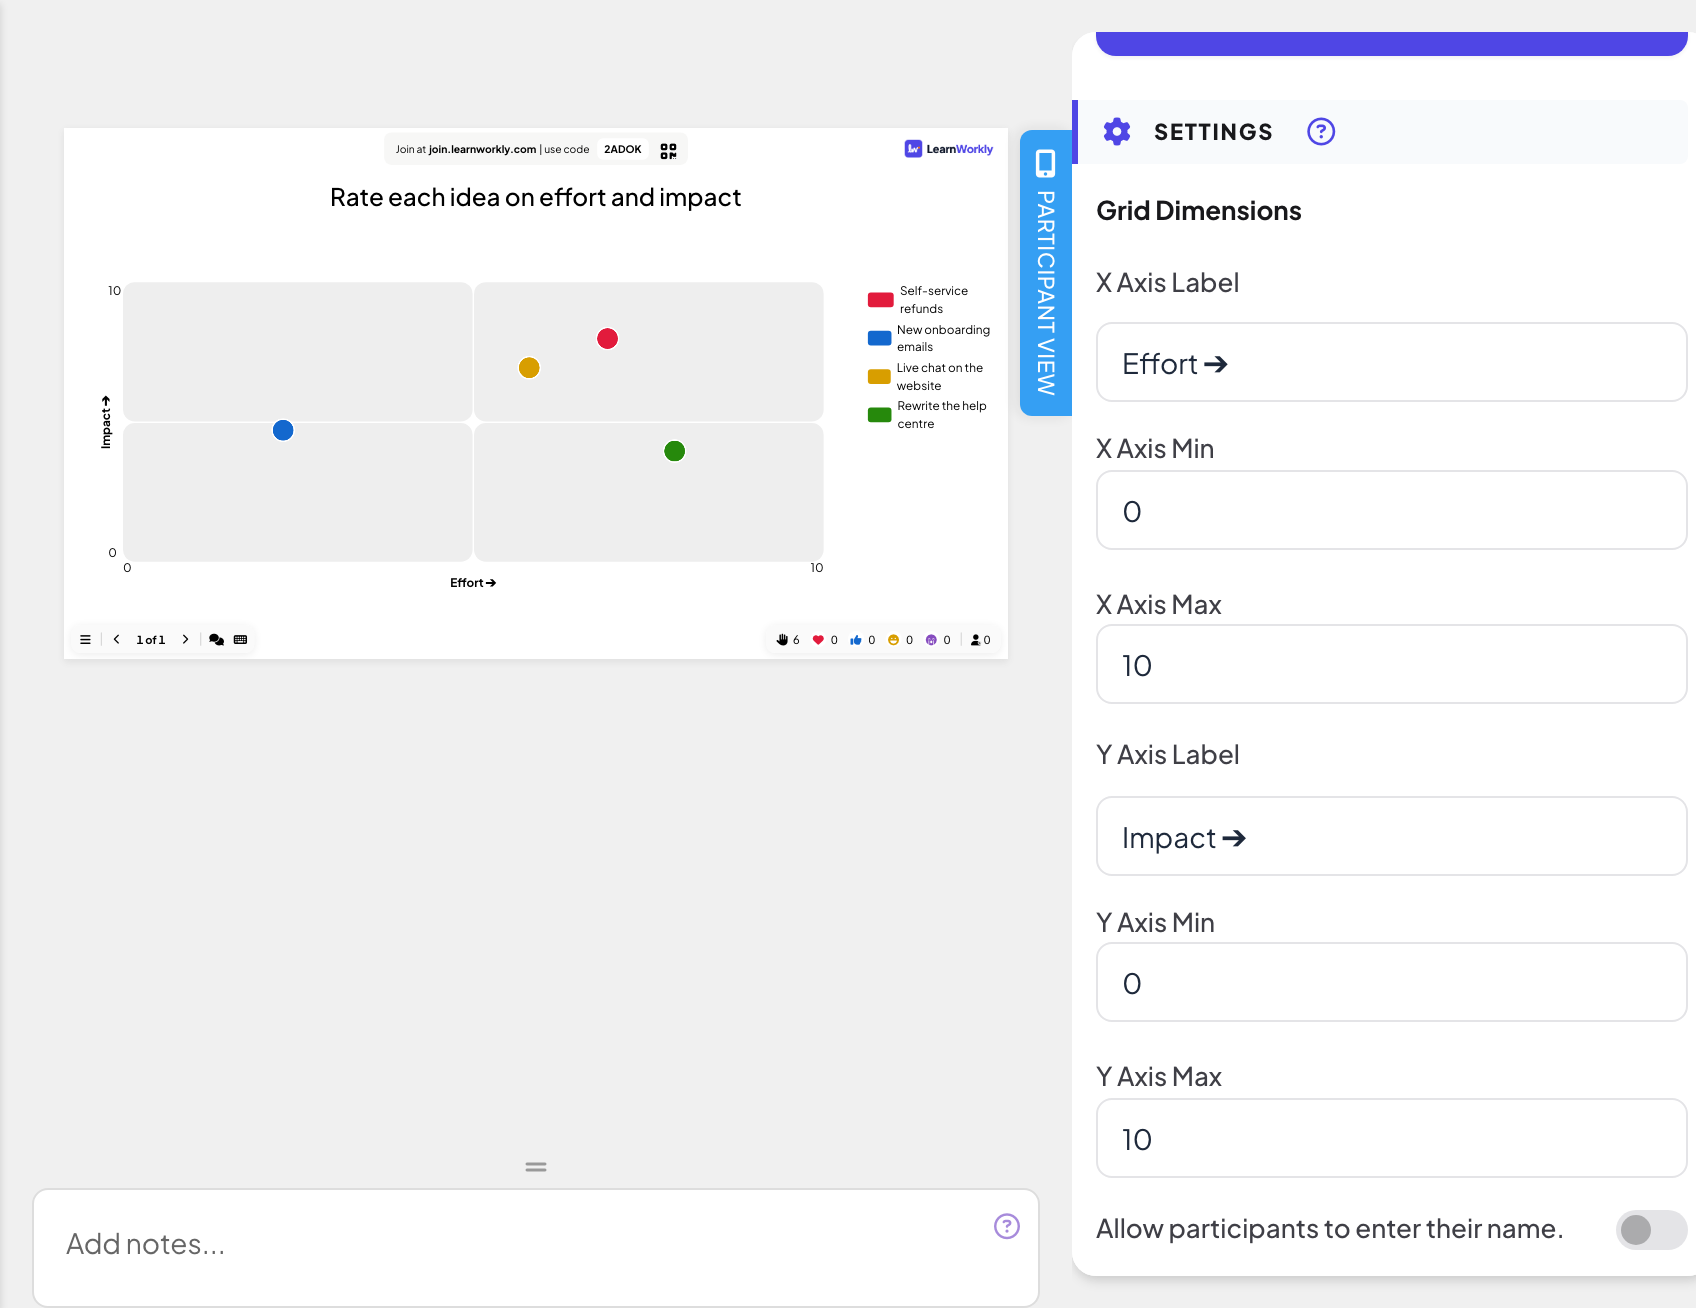
Under Settings, Grid Dimensions, fill in X Axis Label and Y Axis Label (by default "Effort ➔" and "Impact ➔"), and set X Axis Min, X Axis Max, Y Axis Min and Y Axis Max (0 to 10 by default).
Run it live
- 1
Present the slide
Click Present. People join at join.learnworkly.com with your code or the QR code, and the slide appears on their phones.
- 2
People rate each item
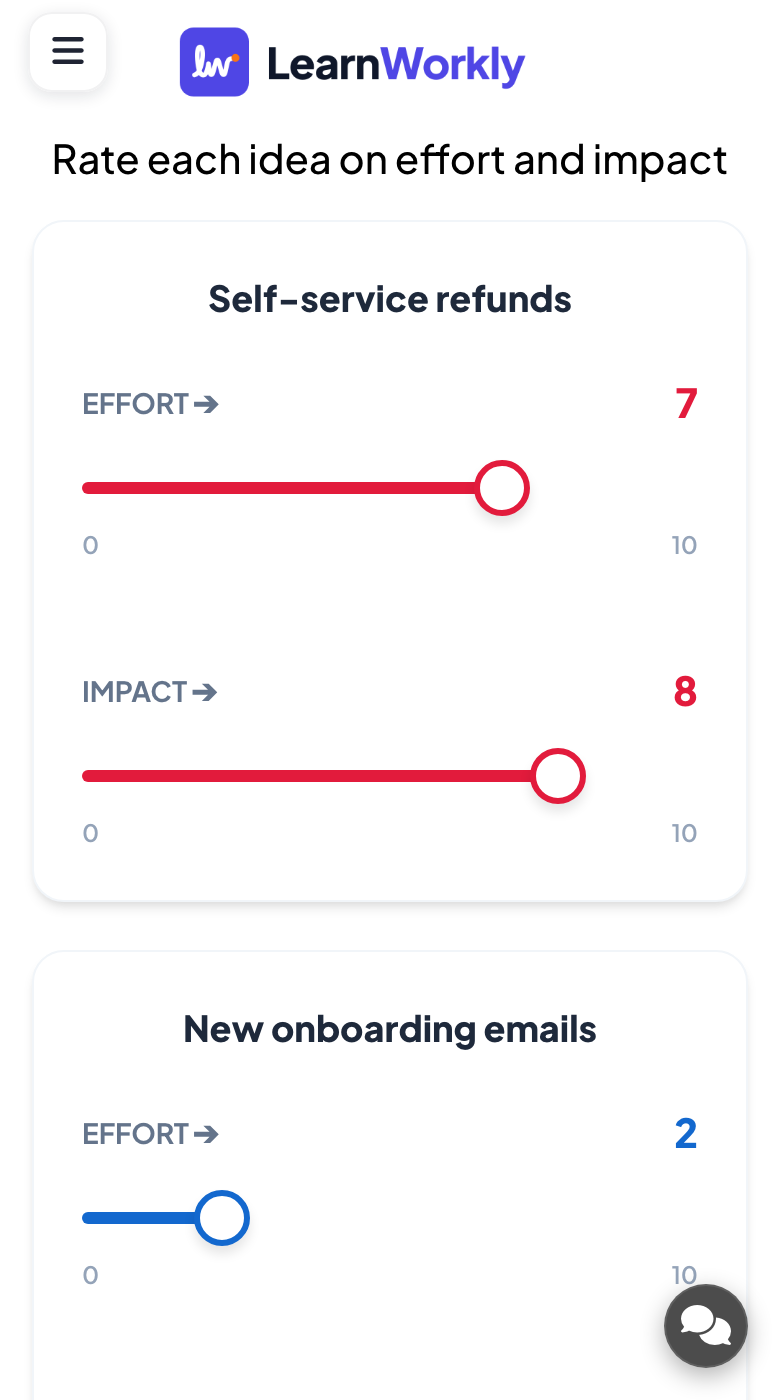
For each item, the phone shows two sliders, one per axis. Participants set both for every item and press Submit.
- 3
Read the grid
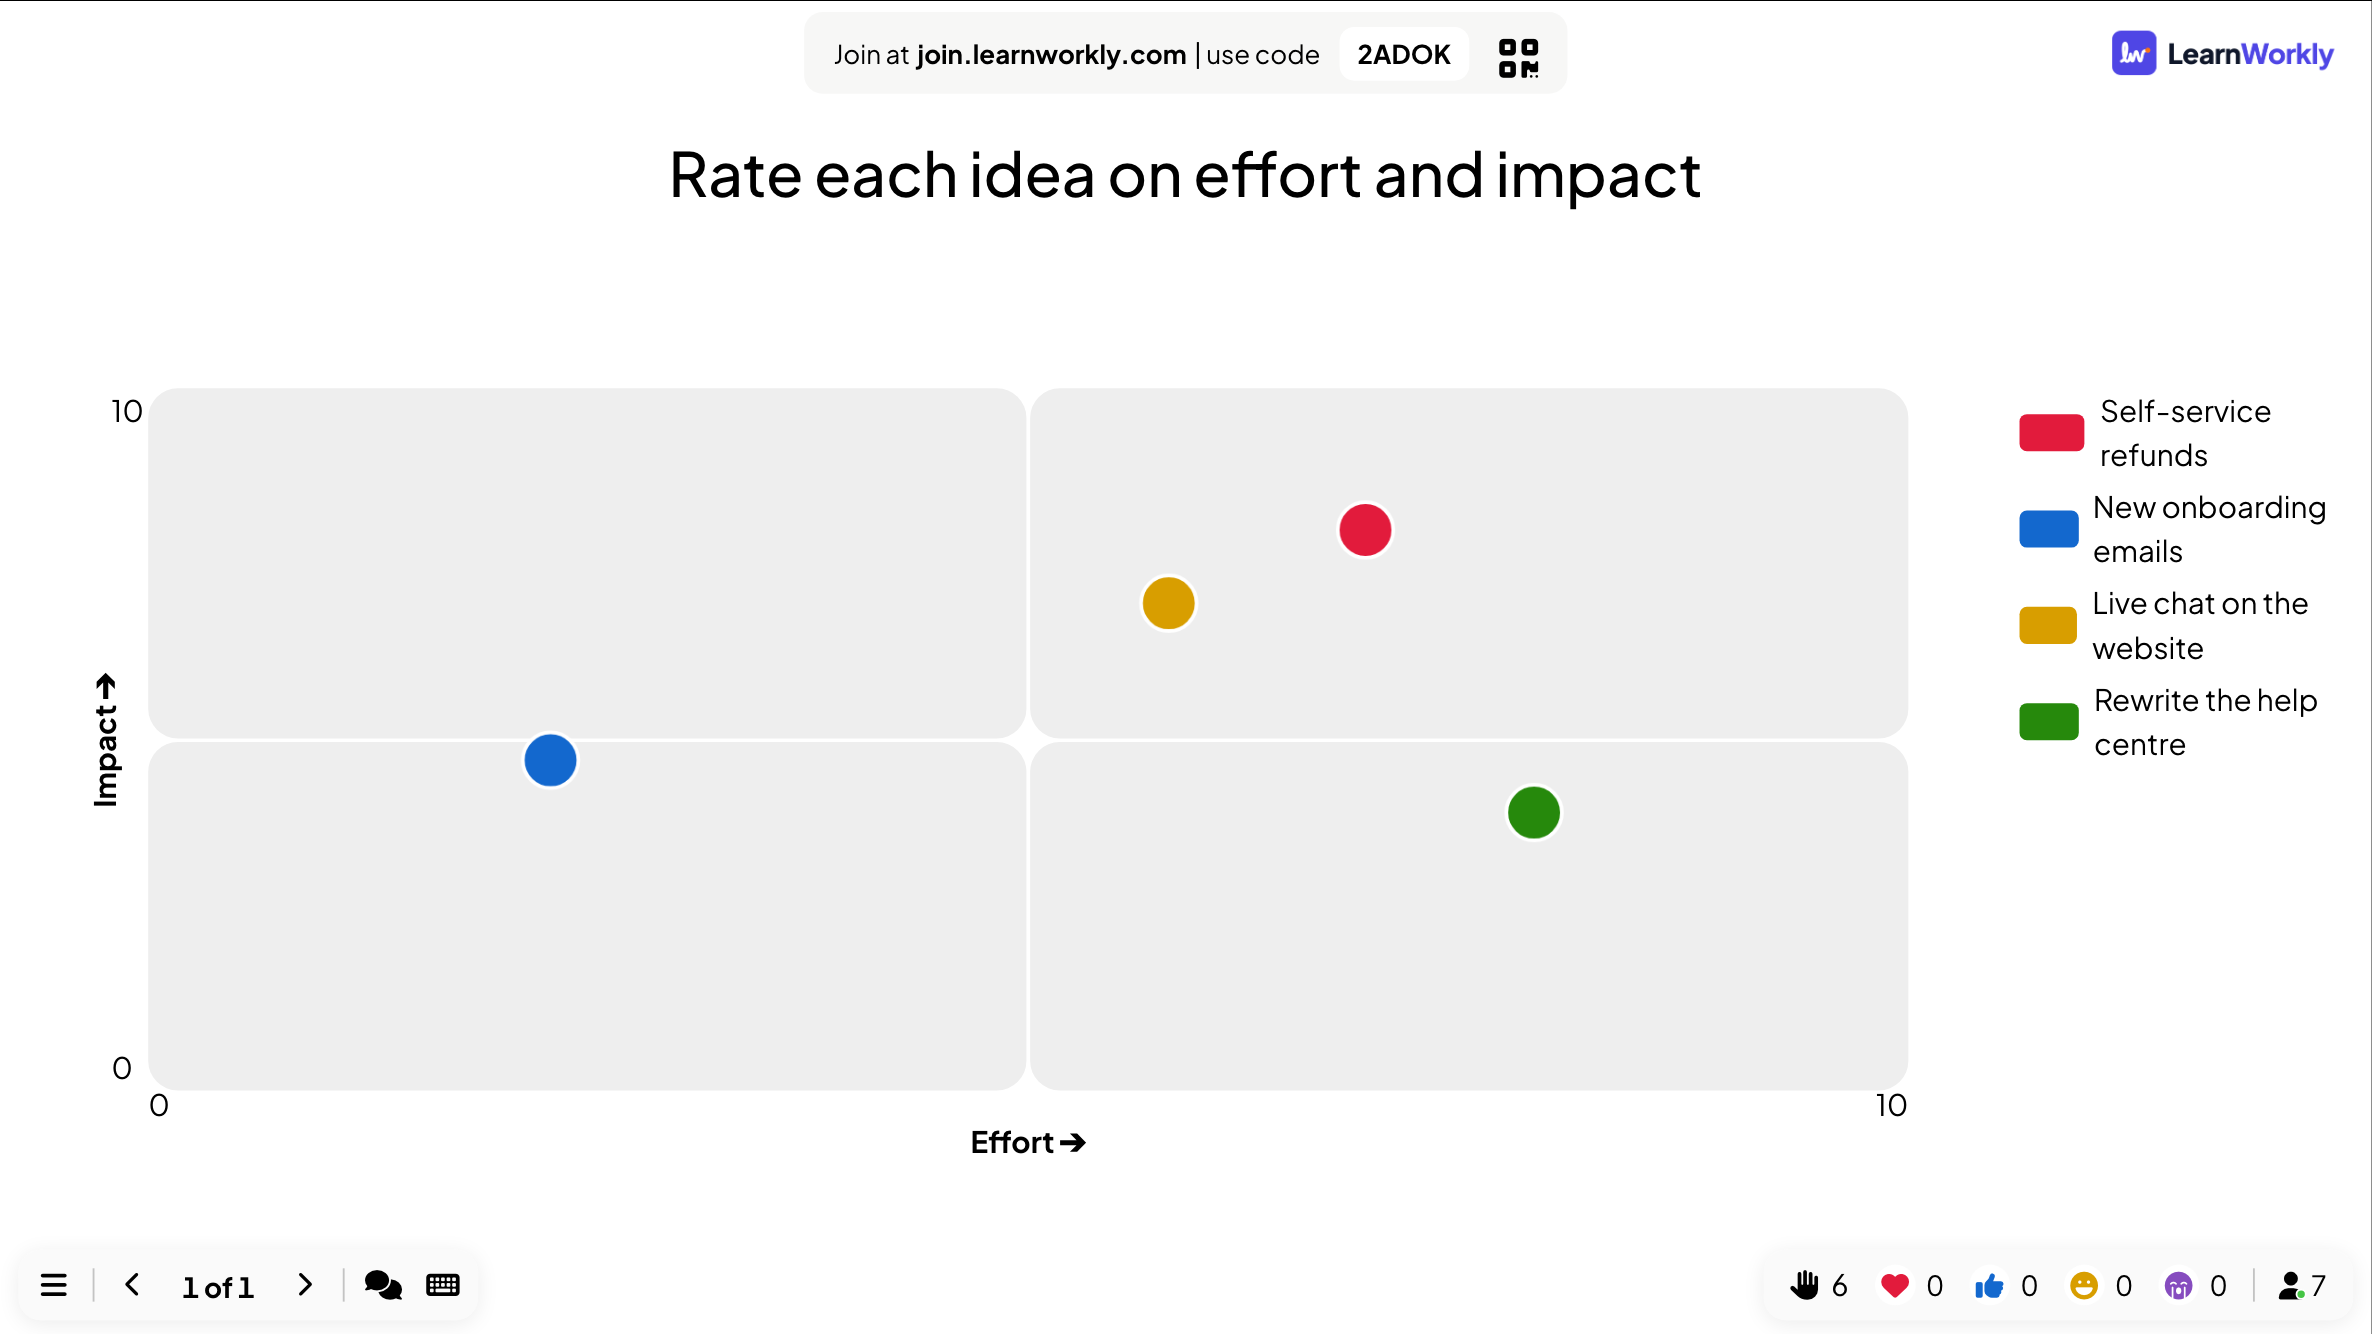
The big screen plots each item at the average of everyone’s answers, split into four quarters.
Other settings
You can also ask for a name, email or avatar, and use Hide result and Stop Submission: see Response settings. This slide has no time limit: use Stop Submission to close it.
Results in the report
After the session, open the presentation’s report (the report button in the editor’s top bar, or Report in your presentation list) and go to Slide Results. See Read the report of a presentation. The report lists each item with its average position on both axes.
Frequently asked questions
Which quarter is "good"?
That depends on your axes. With effort and impact, the quick wins are low effort and high impact.
Can I change the axes after people answered?
You can, but answers keep their numbers. Change the labels and ranges before you present.
How many items should I plot?
Up to 9. Each item needs two sliders on the phone, so fewer items are quicker to answer.
Last checked against the app on 17 November 2026.
Related articles
- Scale: rate statements on a sliderParticipants rate one or more statements on a scale you define, such as 1 to 5 from Strongly disagree to Strongly agree. See the average of each one.
- 100 Points: share out points between optionsParticipants split 100 points between options to show what matters most to them. The big screen shows the average points each option received.
- Response settings for interactive slidesTurn on correct answers, hide results, stop submissions, allow several answers, set a time limit and clear results on polls, word clouds and other slides.