A Ranking slide asks participants to rank options in order of preference. Use it to set priorities, choose a topic or compare ideas.
Set up a ranking
- 1
Add the slide
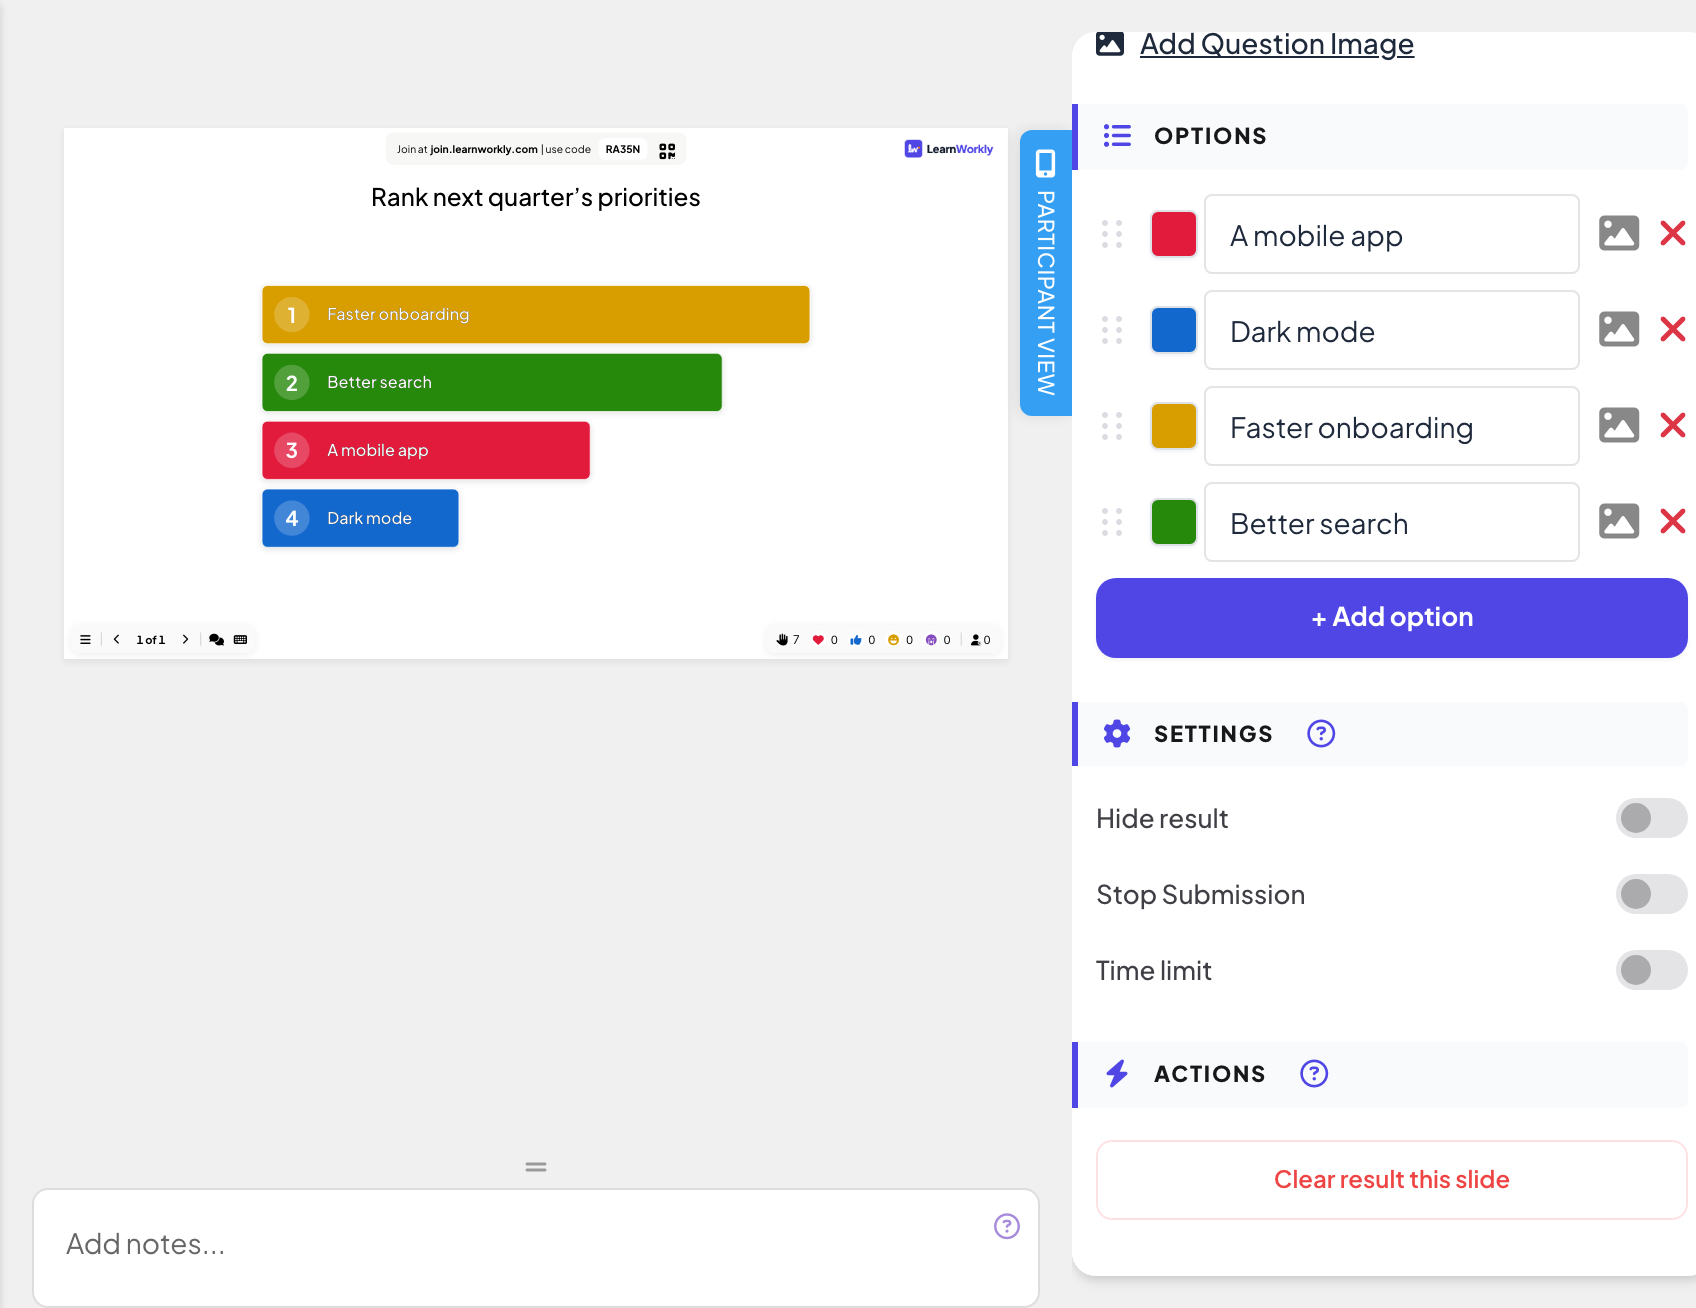
In the editor, click + New Slide. In Choose Slide Type, open the Interactive tab and pick Ranking.
- 2
Write the question
For example "Rank next quarter’s priorities".
- 3
Add the options
Under Options, type each option and click + Add option for more, up to 9. Each option can have an image and its own colour.
- 4
Choose the settings
Use Hide result, Stop Submission or Time limit if you need them: see Response settings.
Run it live
- 1
Present the slide
Click Present. People join at join.learnworkly.com with your code or the QR code, and the slide appears on their phones.
- 2
People drag
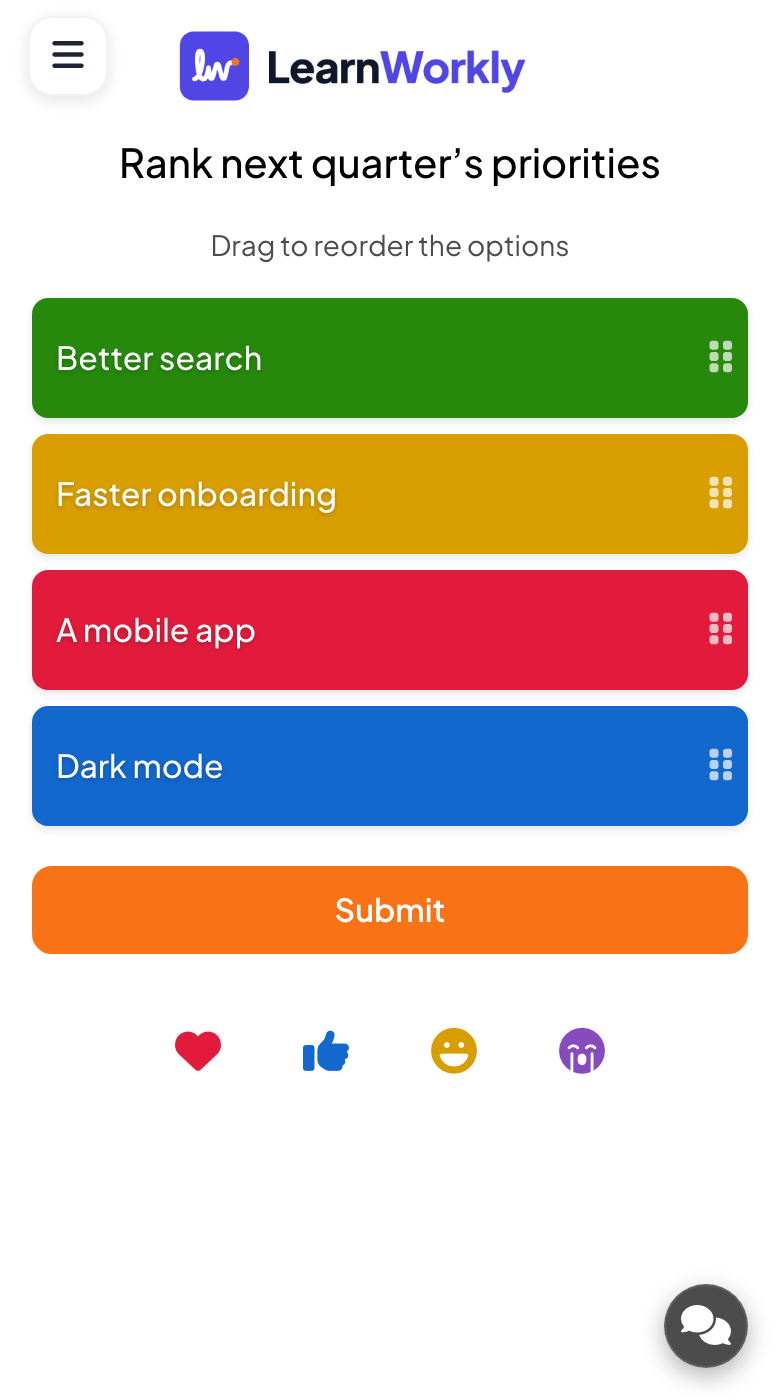
Phones show Drag to reorder the options. Participants drag the options by the handle into their order, top first, and press Submit.
- 3
See the combined ranking
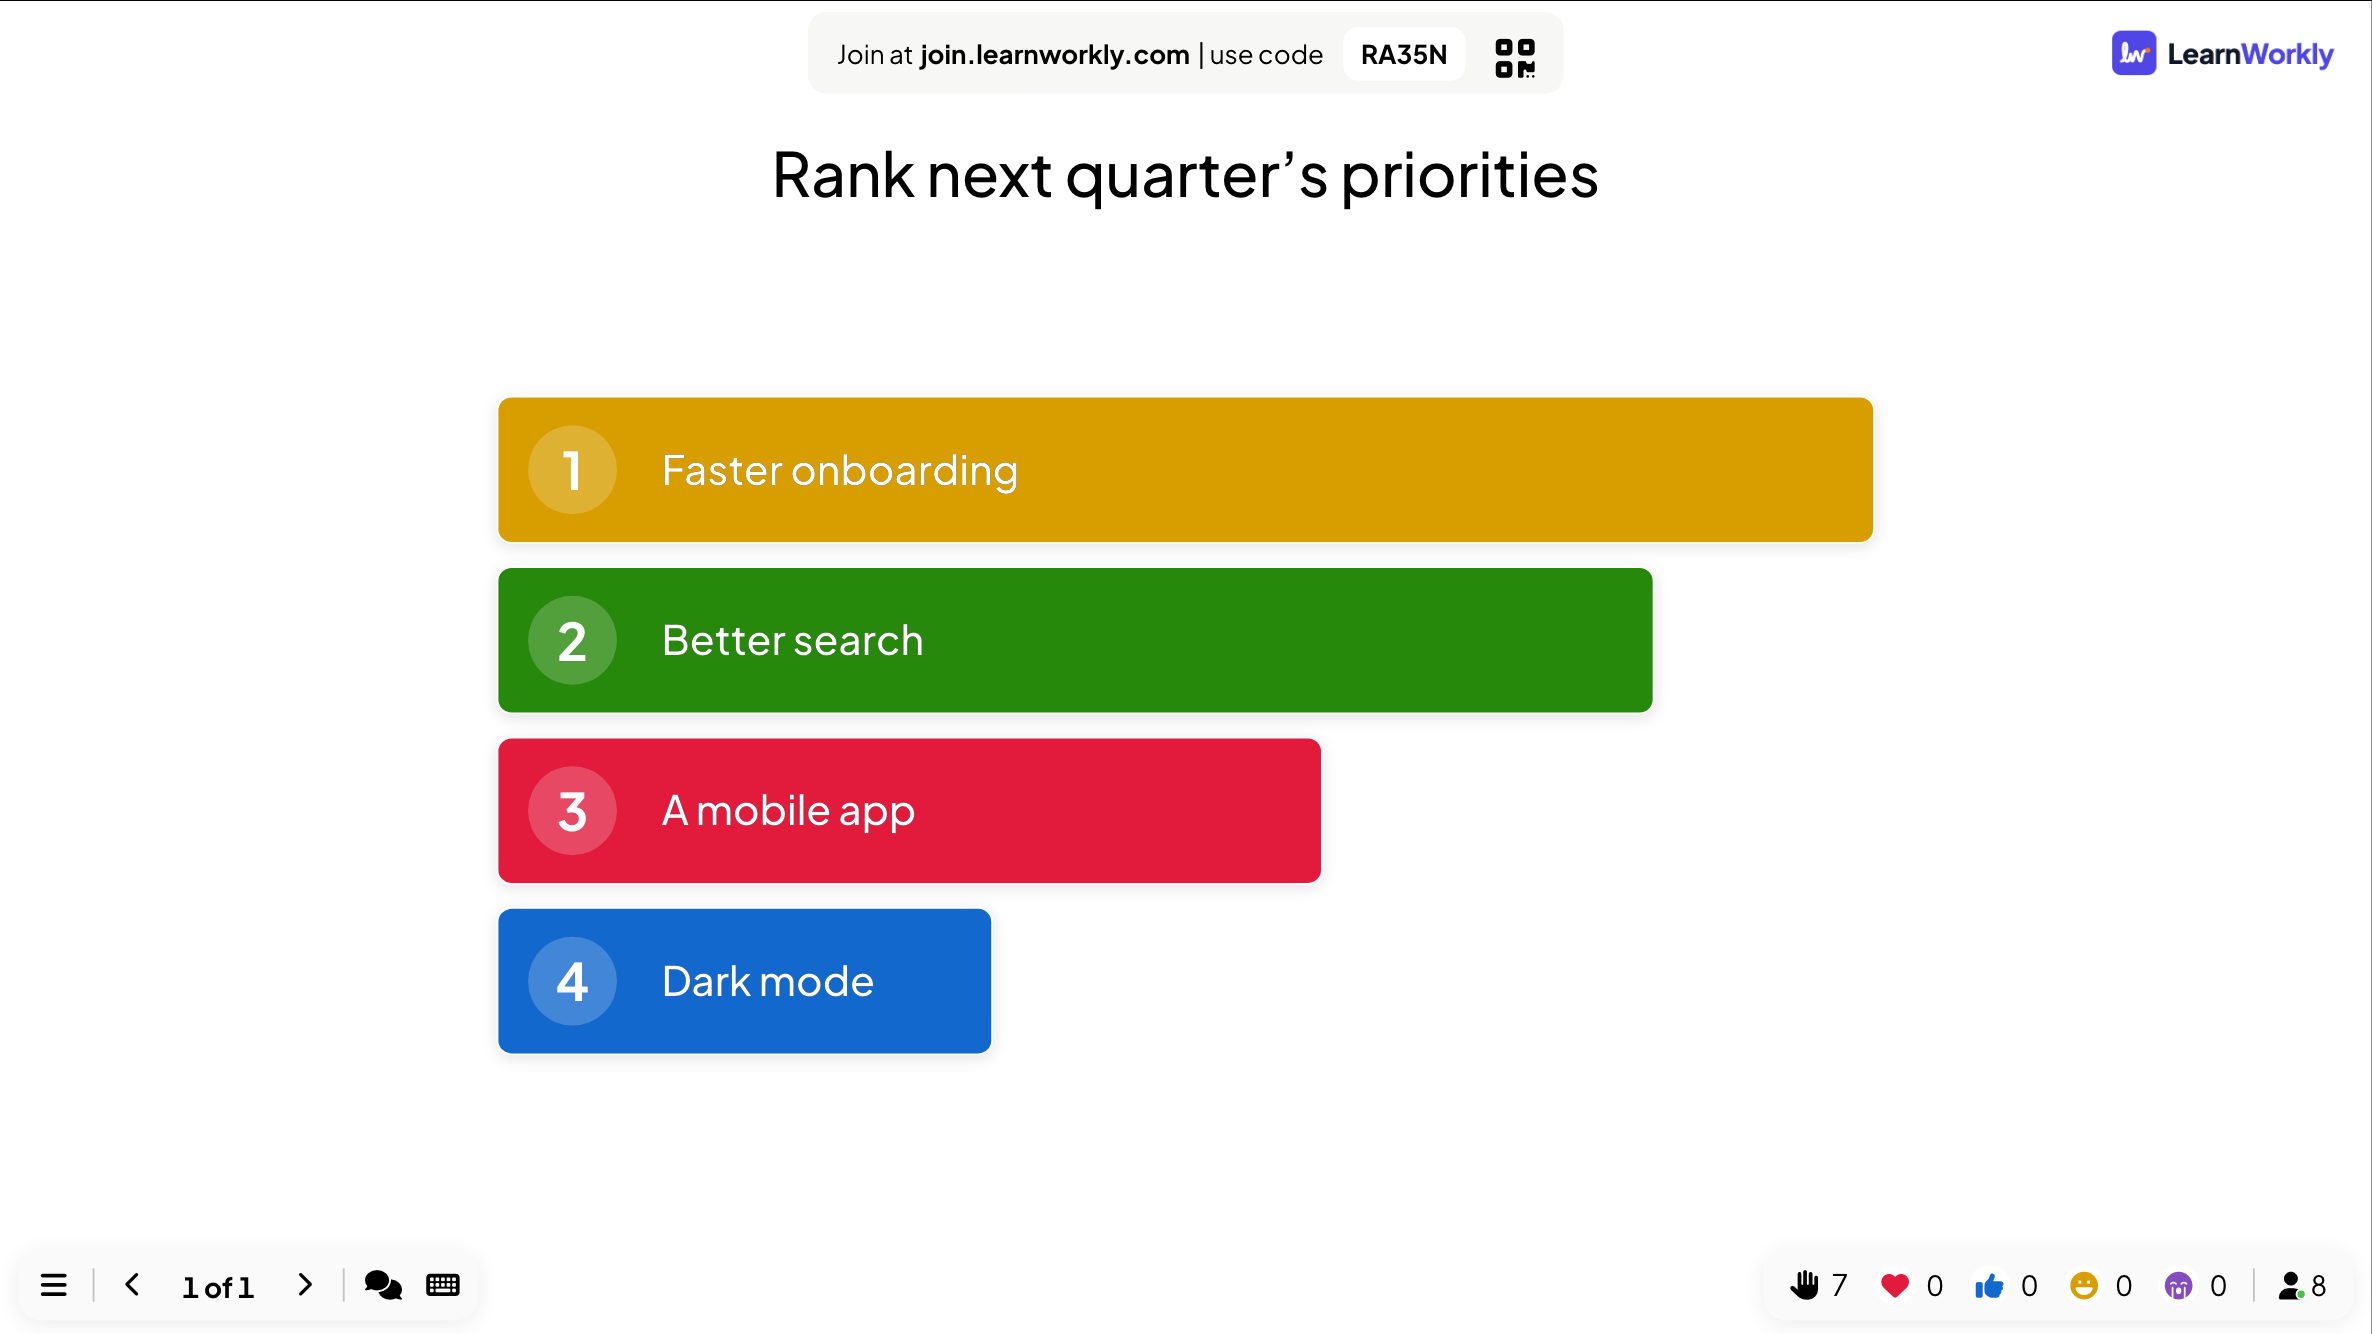
The big screen shows the options as numbered bars, sorted from the highest ranked to the lowest. It updates as answers arrive.
Results in the report
After the session, open the presentation’s report (the report button in the editor’s top bar, or Report in your presentation list) and go to Slide Results. See Read the report of a presentation. A ranking shows a chart of the result, and View Details shows the order each person chose.
Frequently asked questions
How is the combined ranking worked out?
Options placed higher by more people score more. The big screen sorts the options by that total.
Can people submit without moving anything?
Yes. The order they see is sent as their ranking, so ask them to drag the options first.
How many options should I use?
Up to 9 are possible. Four to six are easiest to drag on a phone.
Last checked against the app on 17 November 2026.
Related articles
- Puzzle: put the options in the right orderPlayers drag items into the correct order on their phone: steps of a process, dates on a timeline or sizes from smallest to largest.
- 100 Points: share out points between optionsParticipants split 100 points between options to show what matters most to them. The big screen shows the average points each option received.
- Poll: ask the room and show the votes liveSurvey participant opinions and show them as a bar or pie chart. Set up options, allow more than one pick, mark a correct answer or hide results.