LearnWorkly keeps the results of your presentation in a report, so you can look back at what people answered after the session. Reports are included on every plan; downloading them needs Basic or above.
Open a report
- 1
From Home
Click Report under a presentation in your list.
- 2
From the editor
Click the chart icon in the top bar (Report & export data).

- 3
Pick a session
If you used Clear all results between sessions, each run is kept as a separate session. Choose it from the list next to the presentation code at the top of the report.
The summary
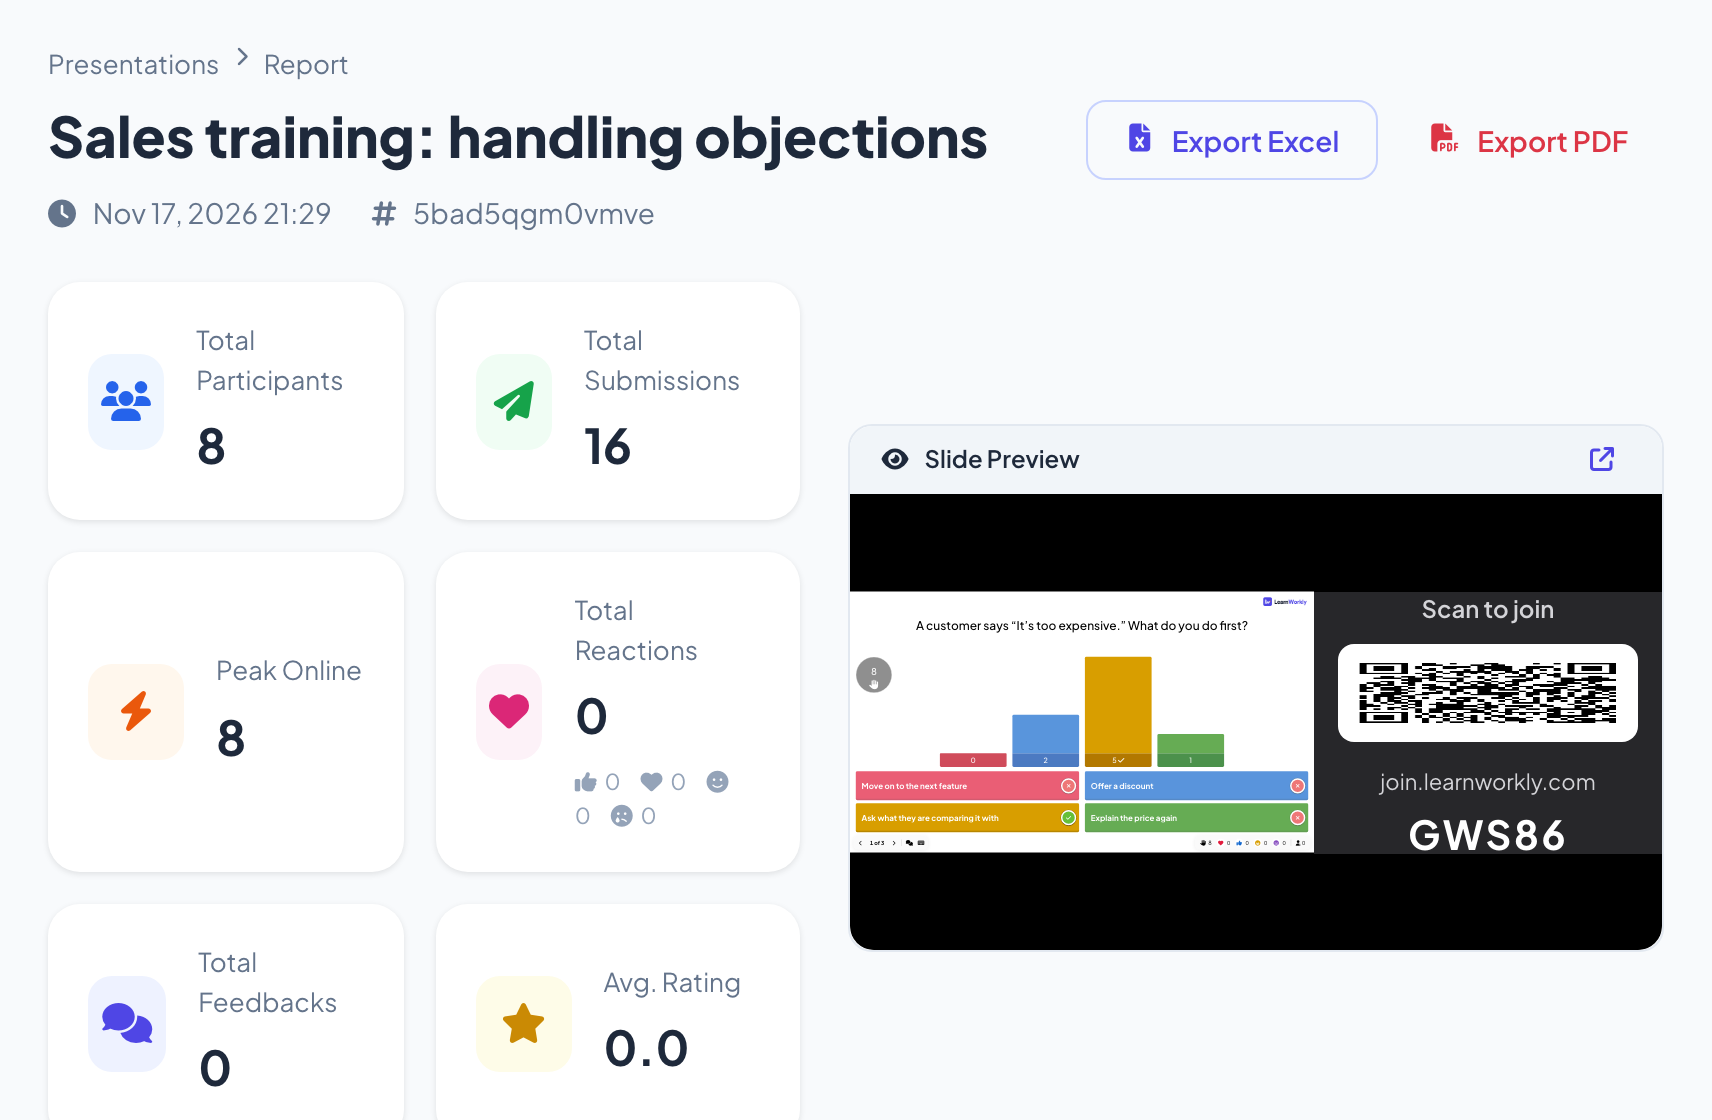
The top of the report shows the date and code of the session, Export Excel and Export PDF, and six totals: Total Participants, Total Submissions, Peak Online, Total Reactions (with the count of each reaction), Total Feedbacks and Avg. Rating. Slide Preview plays back the slides.
Slide by slide
- 1
Slide Results
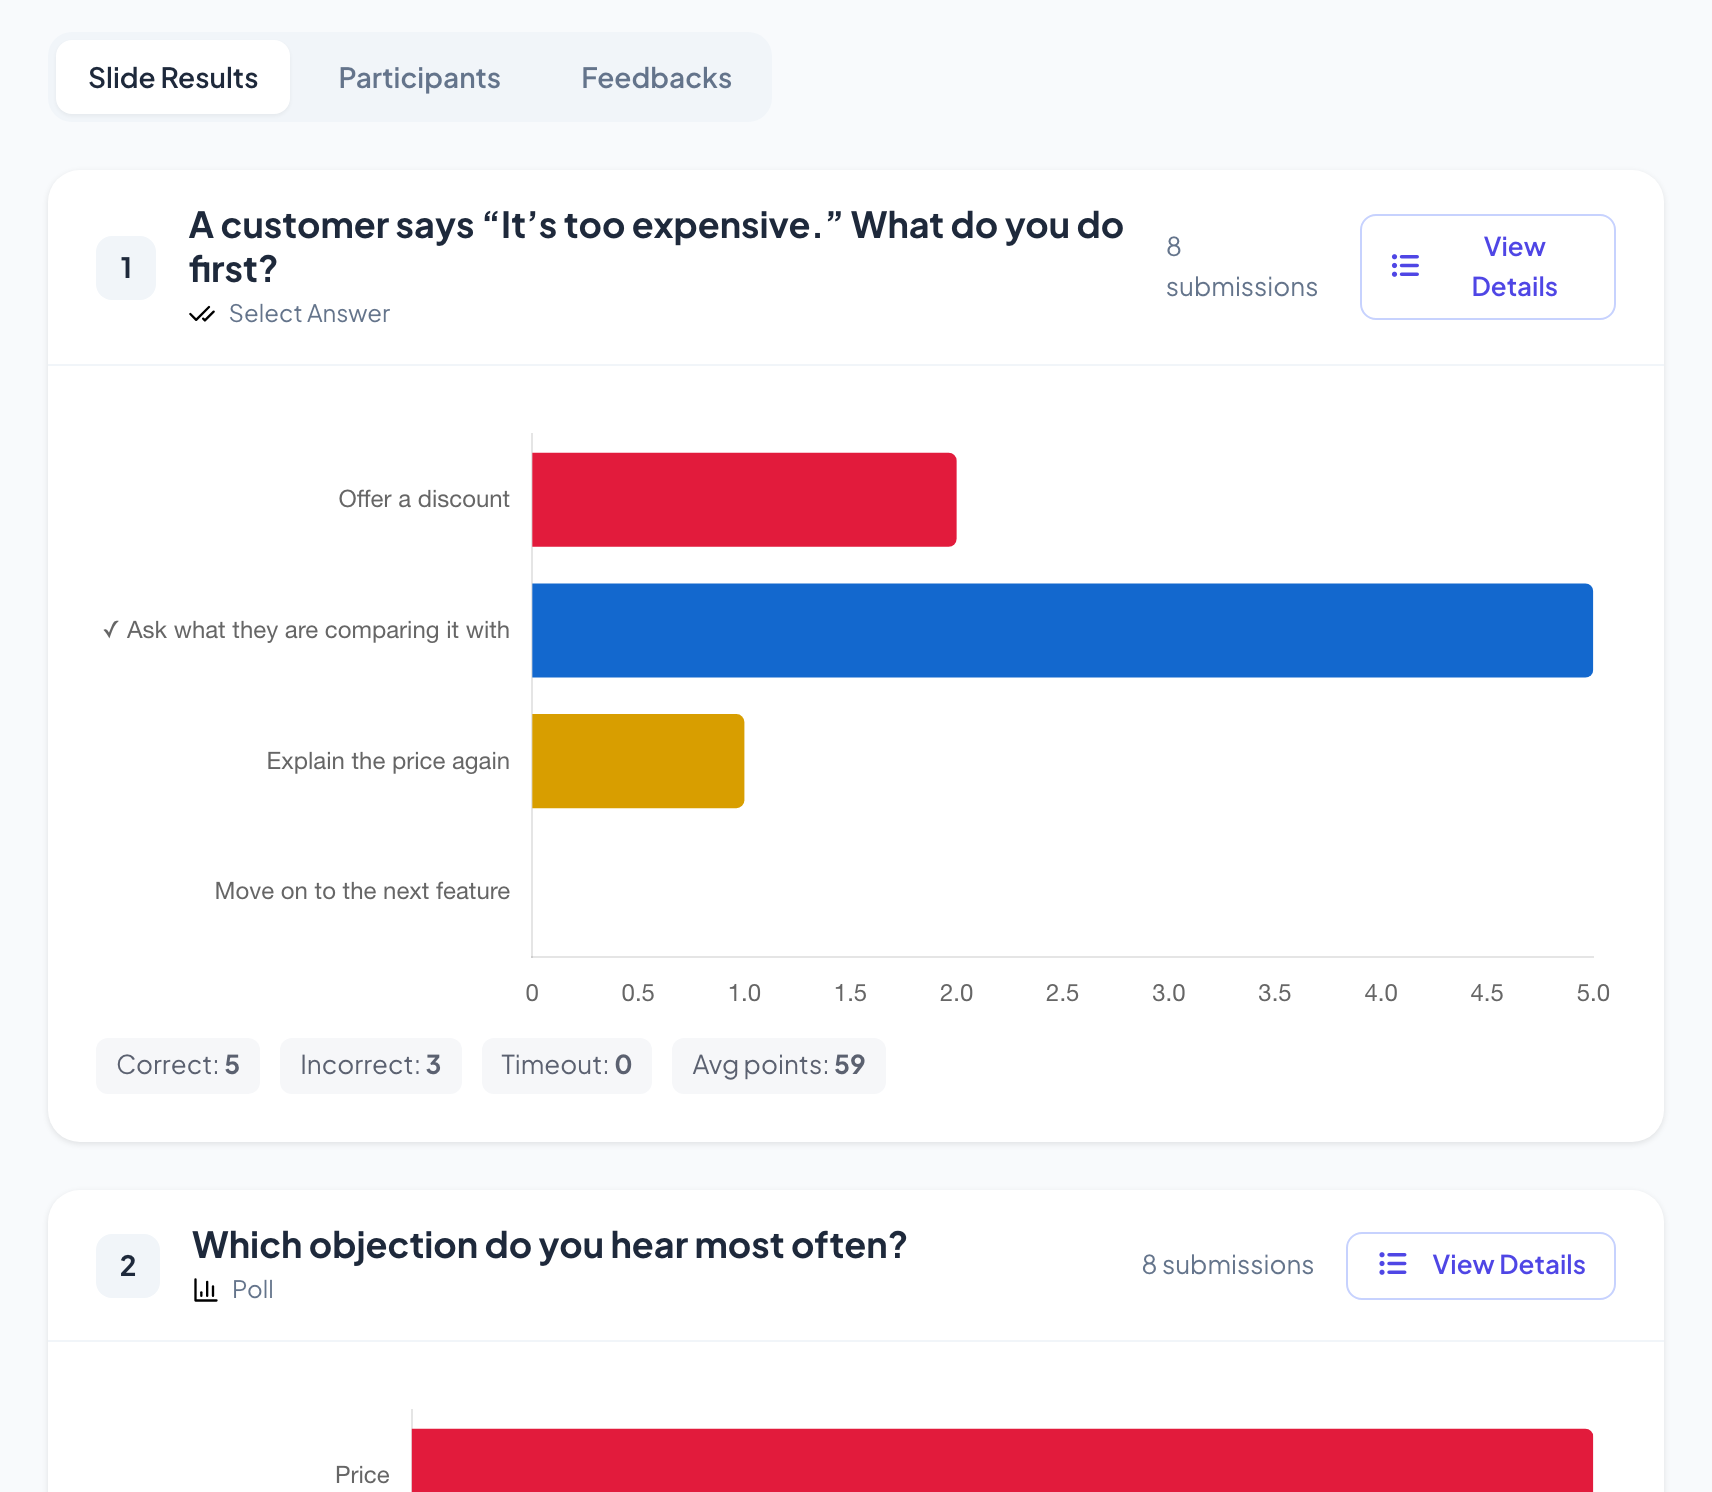
One card per slide with its type, the number of submissions and a chart or list of the answers. Quiz slides also show Correct, Incorrect, Timeout and Avg points, with a tick next to the correct answer.
- 2
Who answered what
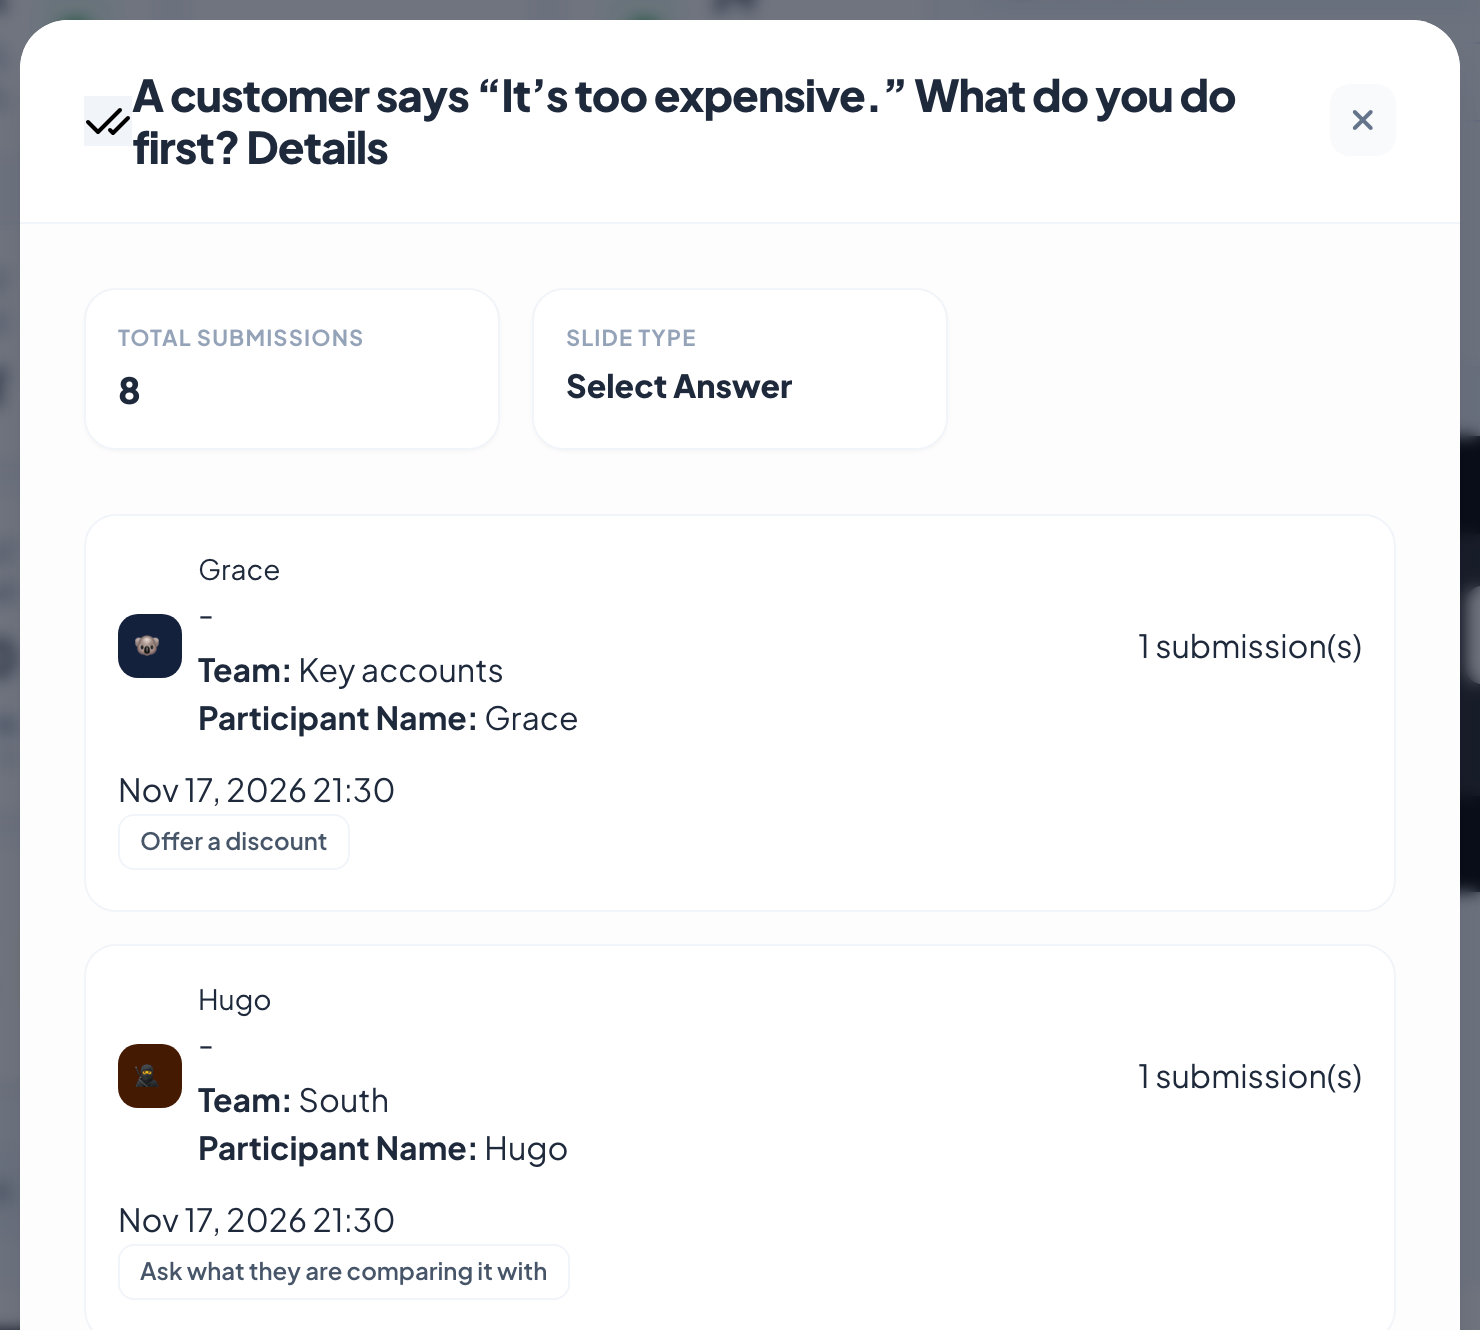
Click View Details on a slide to see each answer with the participant’s name, the details they entered when they joined and the time.
Participants and feedback
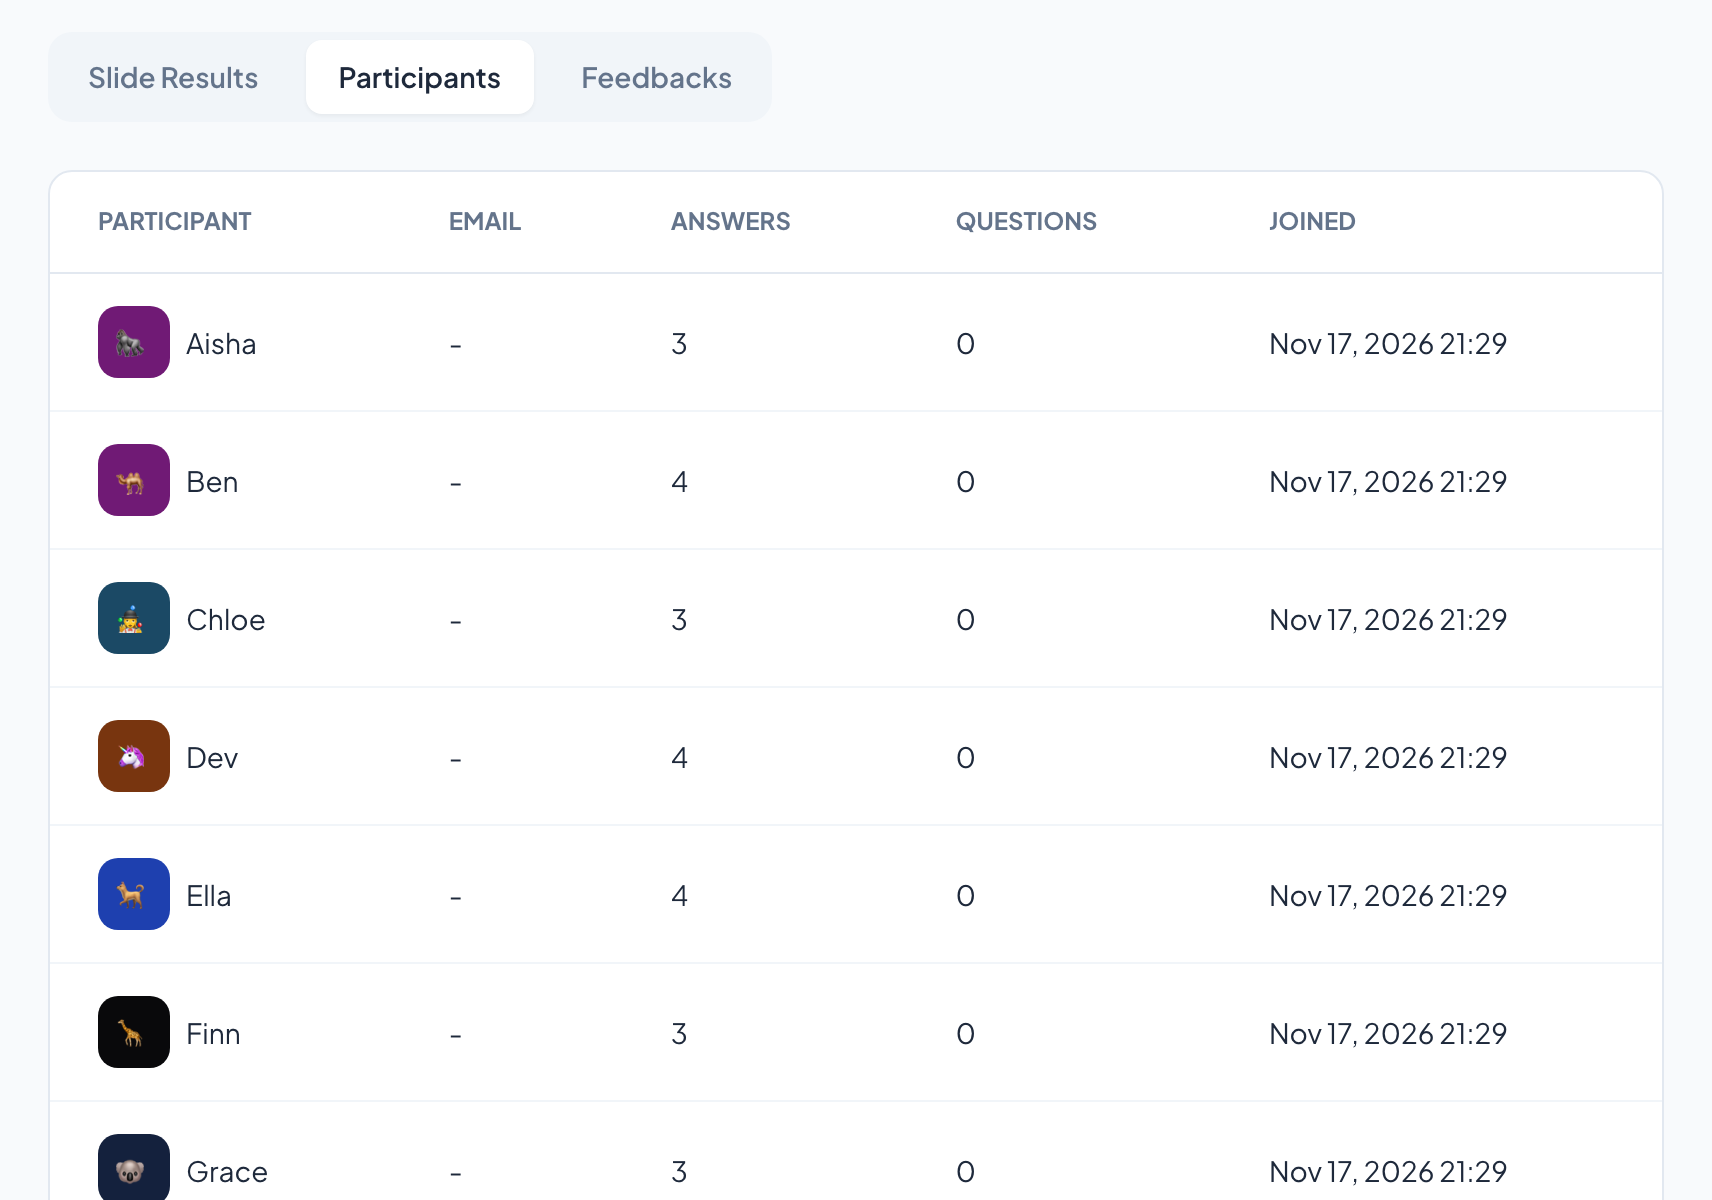
The Participants tab lists everyone who joined, with their email when it was collected, how many answers and questions they sent and when they joined. Feedbacks shows the ratings out of 5 and comments people left about the presentation, with the Average Score and Rating Distribution. When Q&A is on, a Q&A tab lists the questions asked.
Frequently asked questions
Can I see the names of people who answered?
Only if people gave a name, for example a quiz nickname, or if you asked for their details with participant information. Otherwise answers are listed without a name.
Why are Total Submissions higher than Total Participants?
Submissions count every answer. Eight people answering two slides make sixteen submissions.
Where do survey and assignment results go?
Surveys and assignments have their own Responses and Results tabs. See Surveys and Assignments.
Can I download the report?
Yes, on the Basic, Pro and Enterprise plans. See Export results to PDF or Excel.
Last checked against the app on 17 November 2026.
Related articles
- Export results to PDF or ExcelDownload the report of a presentation as an Excel file or a PDF on Basic, Pro and Enterprise, and export survey and assignment results on any plan.
- Collect participant informationAsk participants for their name and any other details you need, such as a team or a department, before they can take part in your presentation.
- Create a survey and collect responsesBuild a self-paced survey with text, choice, rating, NPS and file upload questions, share it with a link or QR code and read the responses live.