With Pin on image, participants tap a spot on a picture. Use it for "where would you…" questions, maps, diagrams, floor plans or a screenshot of a product. There is no right answer: to score a correct spot, use Pin Answer instead.
Set it up
- 1
Add the slide
In the editor, click + New Slide. In Choose Slide Type, open the Interactive tab and pick Pin on image.
- 2
Write the question
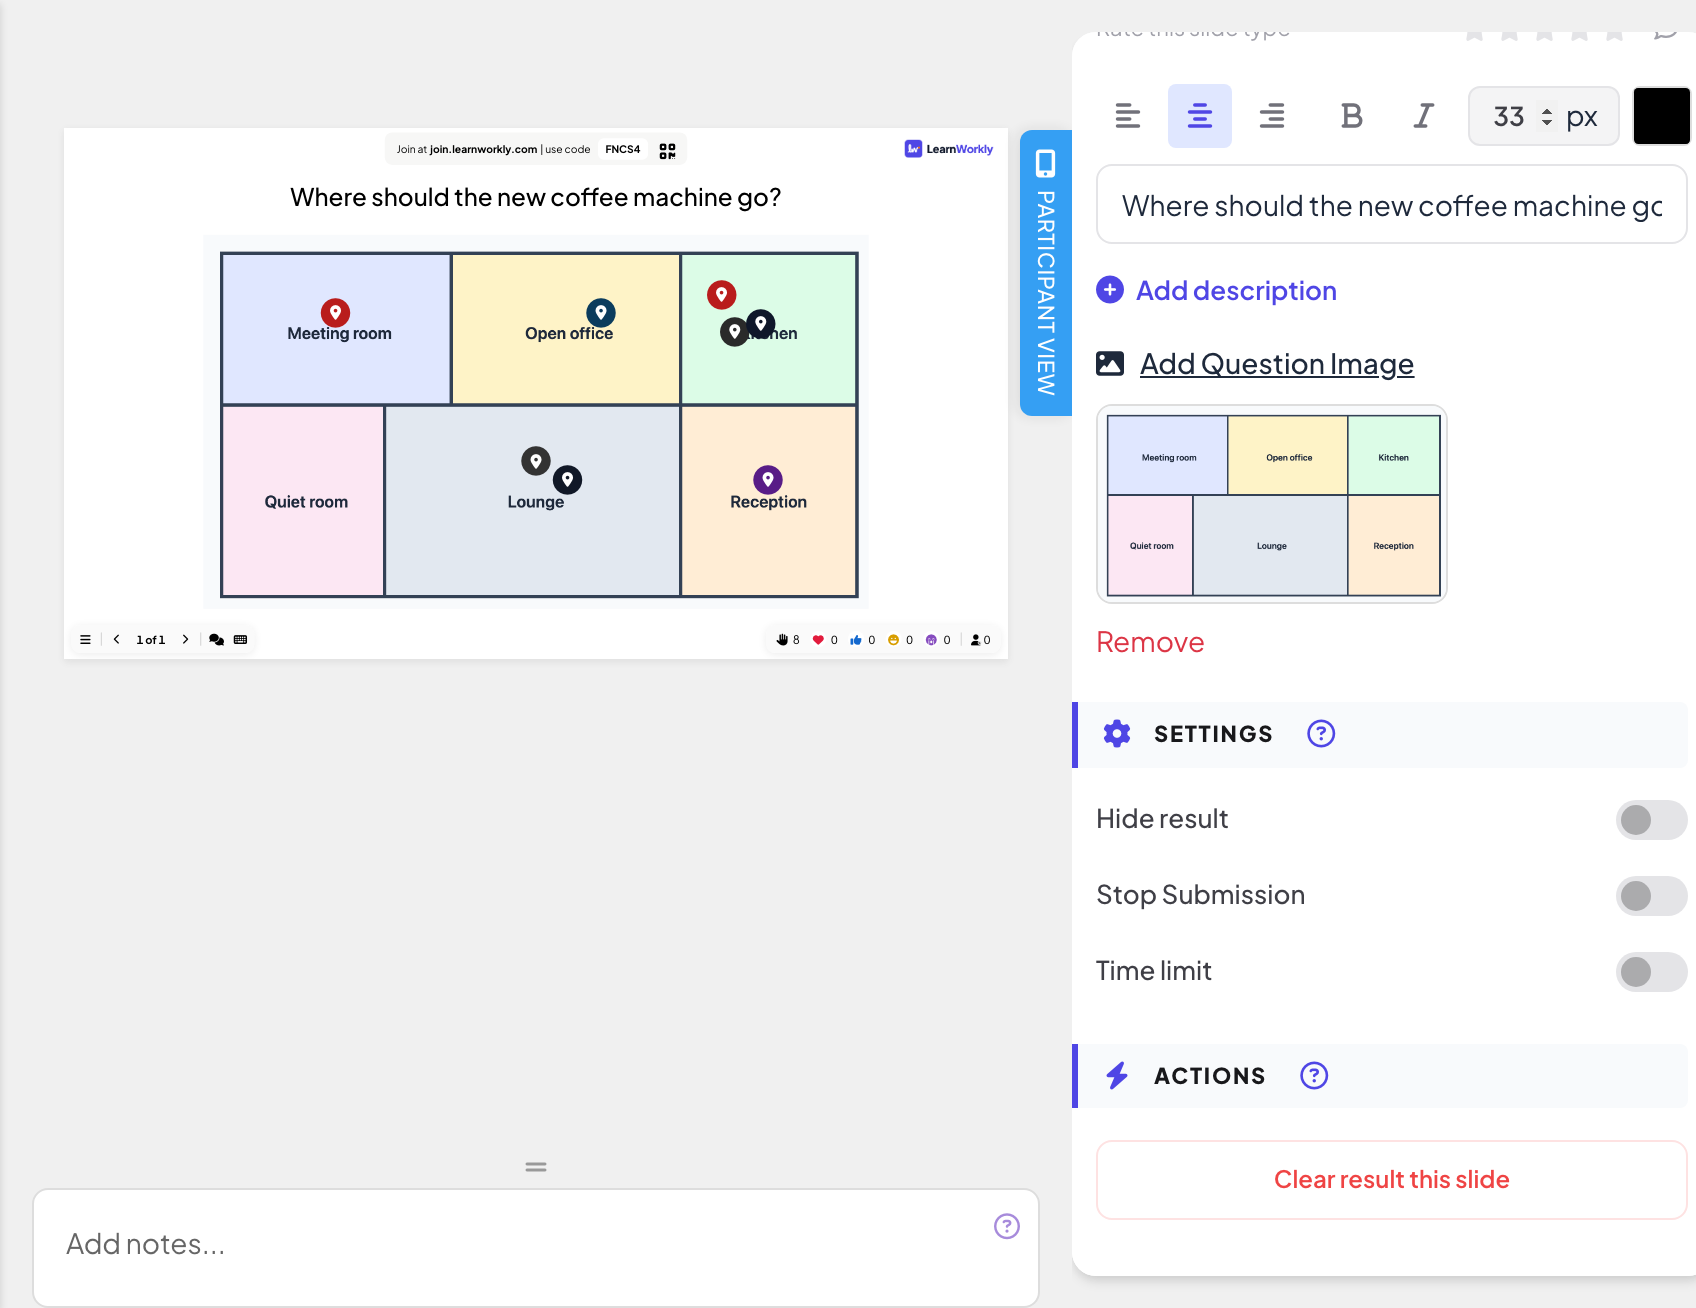
For example "Where should the new coffee machine go?".
- 3
Upload the picture
Click Add Question Image and choose an image. Until you do, the slide reminds you to upload one. Remove under the thumbnail takes it away again.
- 4
Choose the settings
Use Hide result, Stop Submission or Time limit if you need them: see Response settings.
Run it live
- 1
Present the slide
Click Present. People join at join.learnworkly.com with your code or the QR code, and the slide appears on their phones.
- 2
People drop a pin
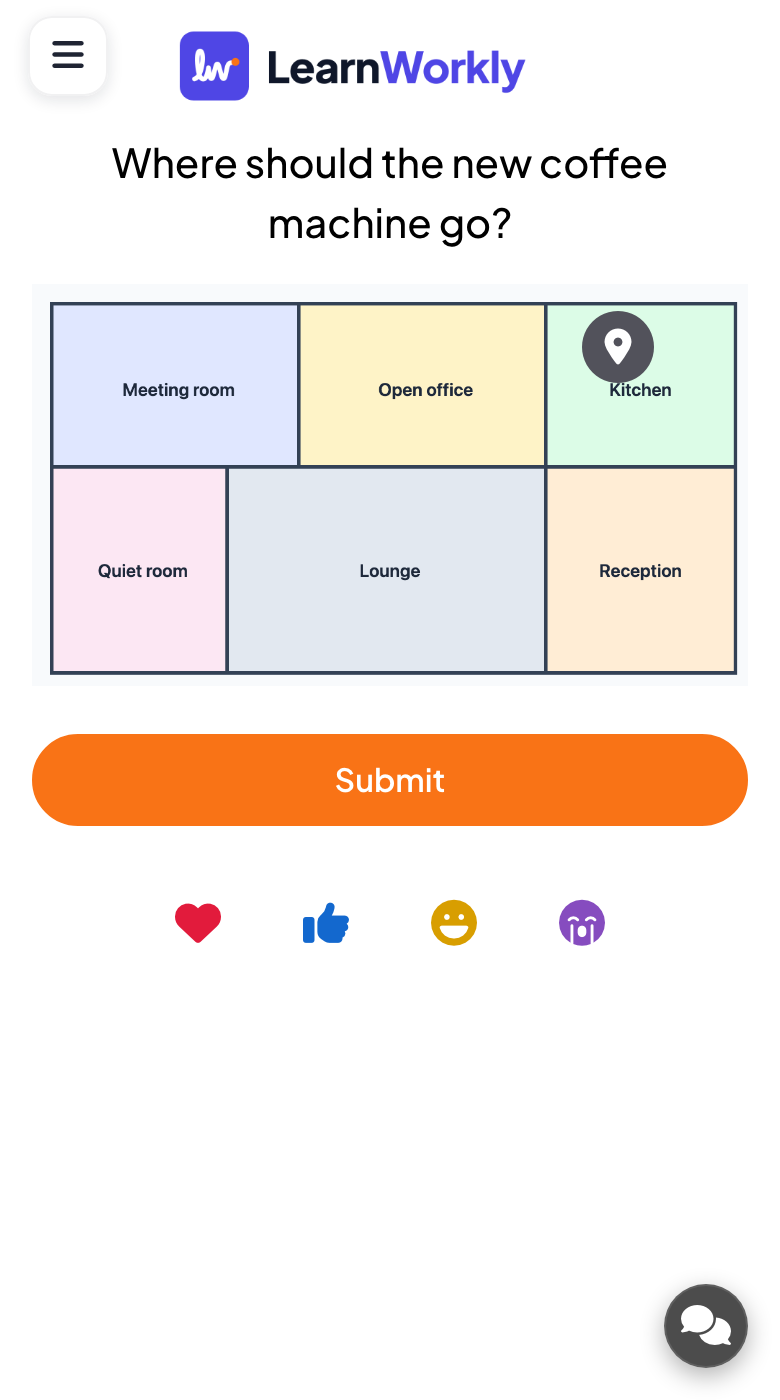
Participants tap the picture on their phone to place a pin (tapping again moves it) and press Submit. Each person has one pin.
- 3
Watch the pins
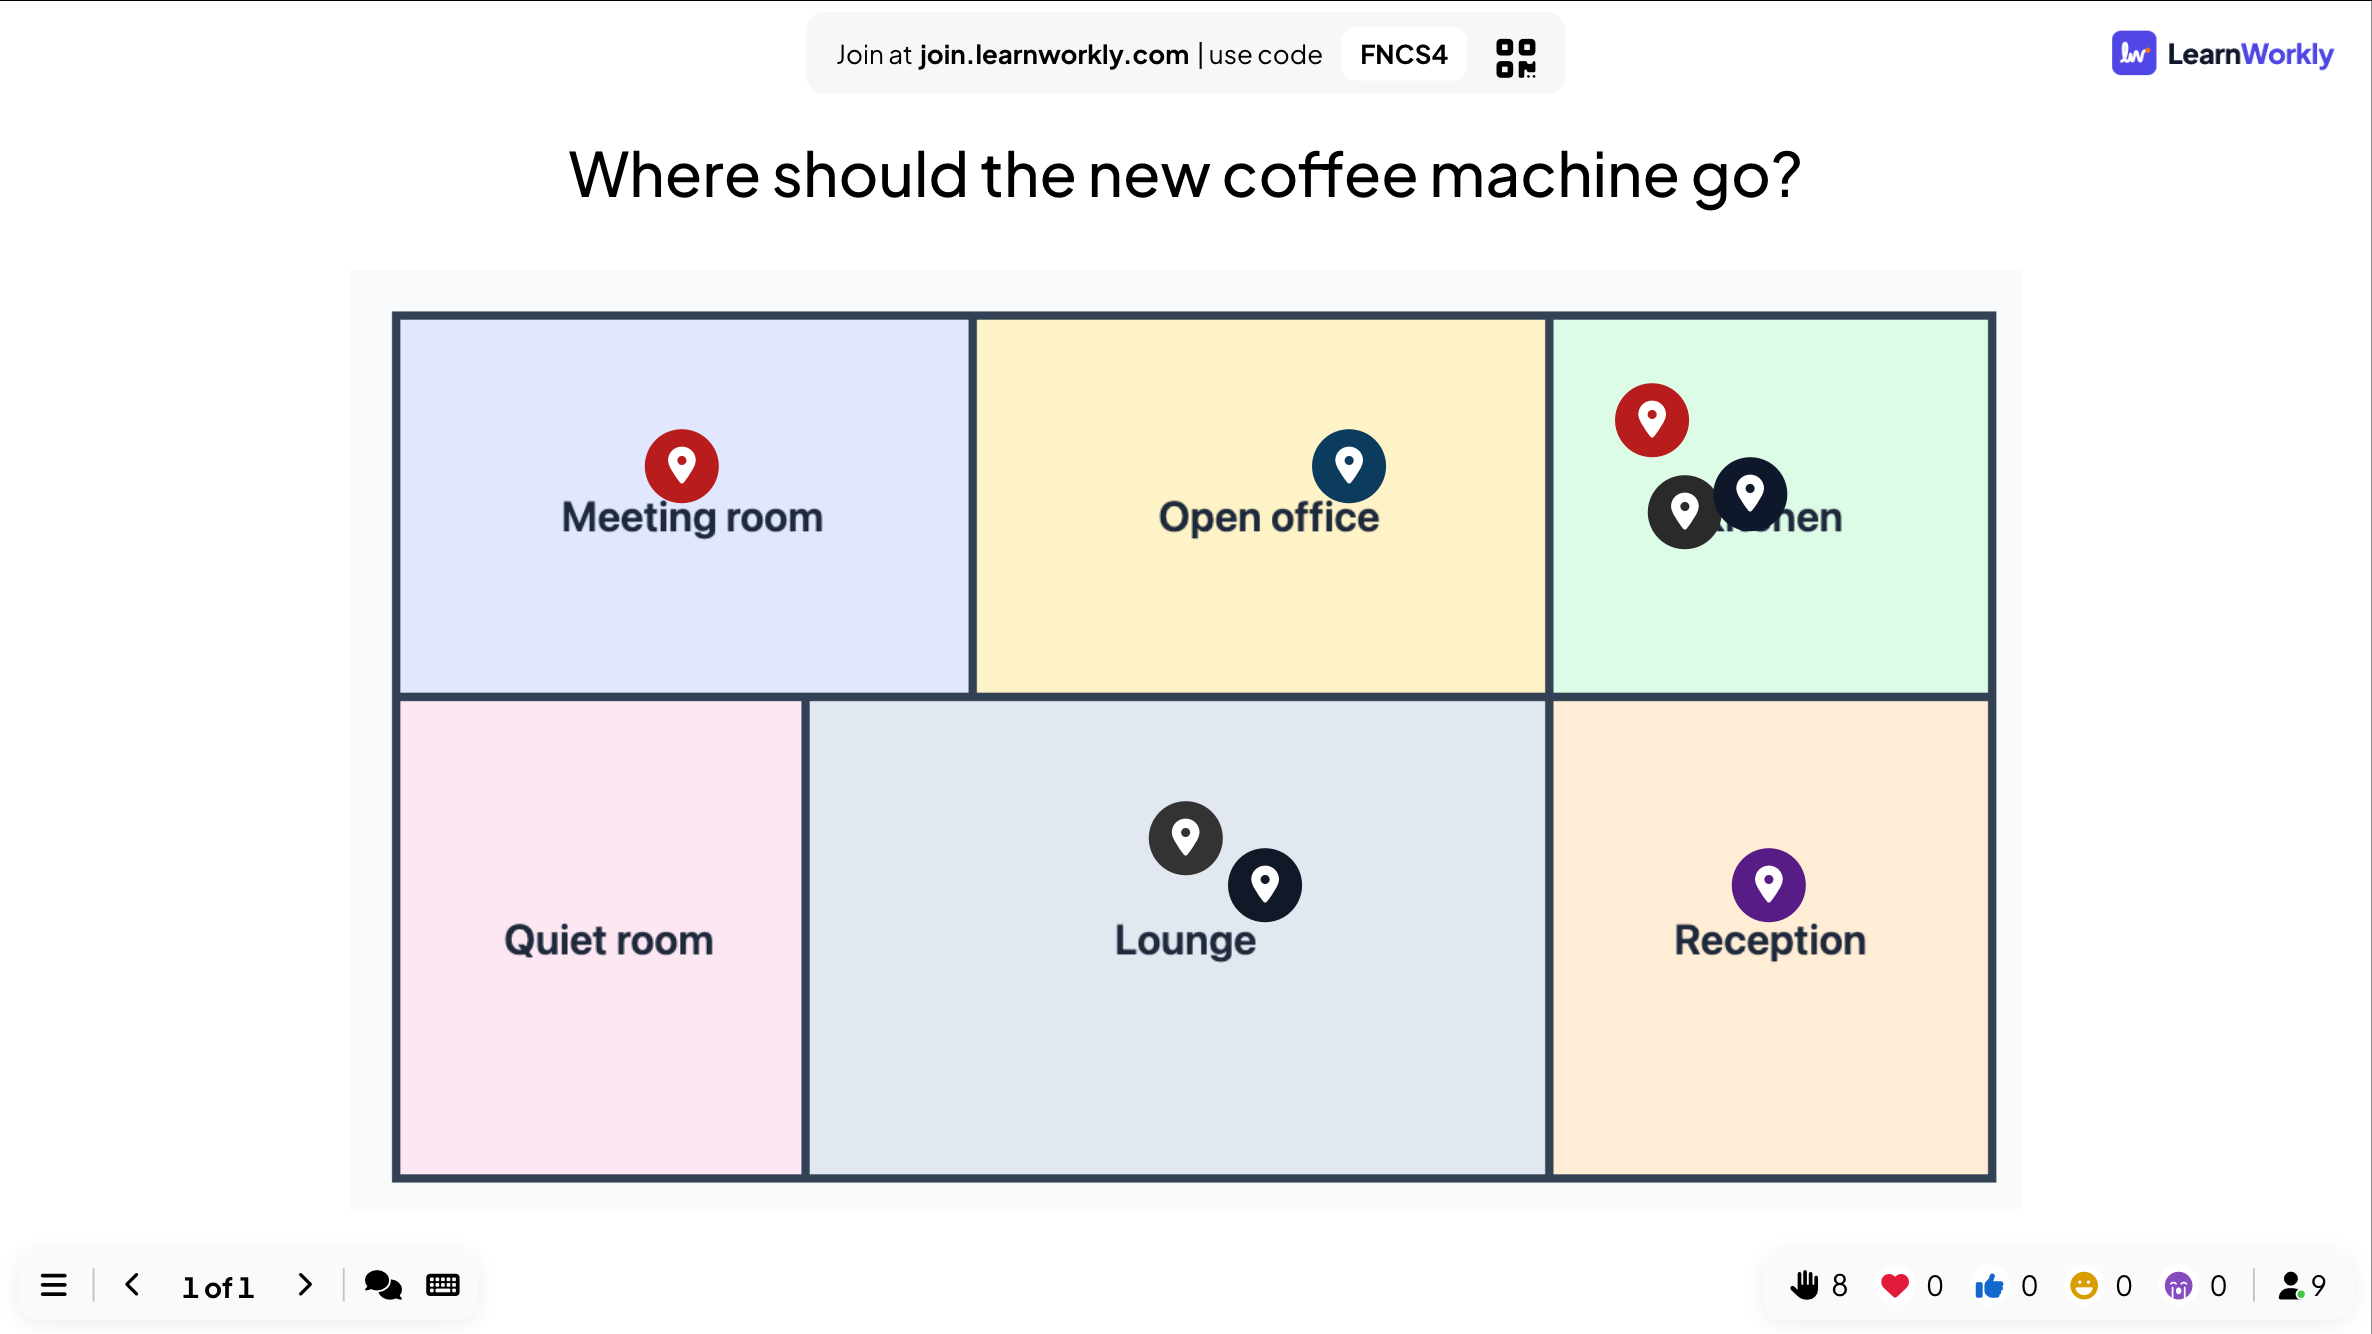
Every pin appears on the picture on the big screen as it arrives. Hover a pin to see the participant’s name if they gave one.
Results in the report
After the session, open the presentation’s report (the report button in the editor’s top bar, or Report in your presentation list) and go to Slide Results. See Read the report of a presentation. The report shows the picture with every pin on it.
Frequently asked questions
What picture works best?
A landscape (wide) image with clear areas, such as a map, plan or diagram. Small details are hard to tap on a phone.
Can people change their pin after submitting?
No. After Submit, the pin is locked.
Can I mark the right spot?
Not on this slide. Use the Pin Answer quiz slide to score a correct area.
Last checked against the app on 17 November 2026.
Related articles
- Pin Answer: tap the right spot on a picturePlayers drop a pin on a map, diagram or screenshot. A pin on the right area scores. Use a ready-made map or upload your own picture and mark the areas.
- 2x2 Grid: plot items on two axesParticipants rate each item on two axes, such as effort and impact, and the big screen plots the average position of every item on a 2x2 grid.
- Response settings for interactive slidesTurn on correct answers, hide results, stop submissions, allow several answers, set a time limit and clear results on polls, word clouds and other slides.