A Scale slide asks participants how much they agree with statements, or how they rate them. It is good for confidence checks, feedback and comparing several ideas at once.
Set up a scale
- 1
Add the slide
In the editor, click + New Slide. In Choose Slide Type, open the Interactive tab and pick Scale.
- 2
Write the question
For example "How much do you agree?".
- 3
Add statements
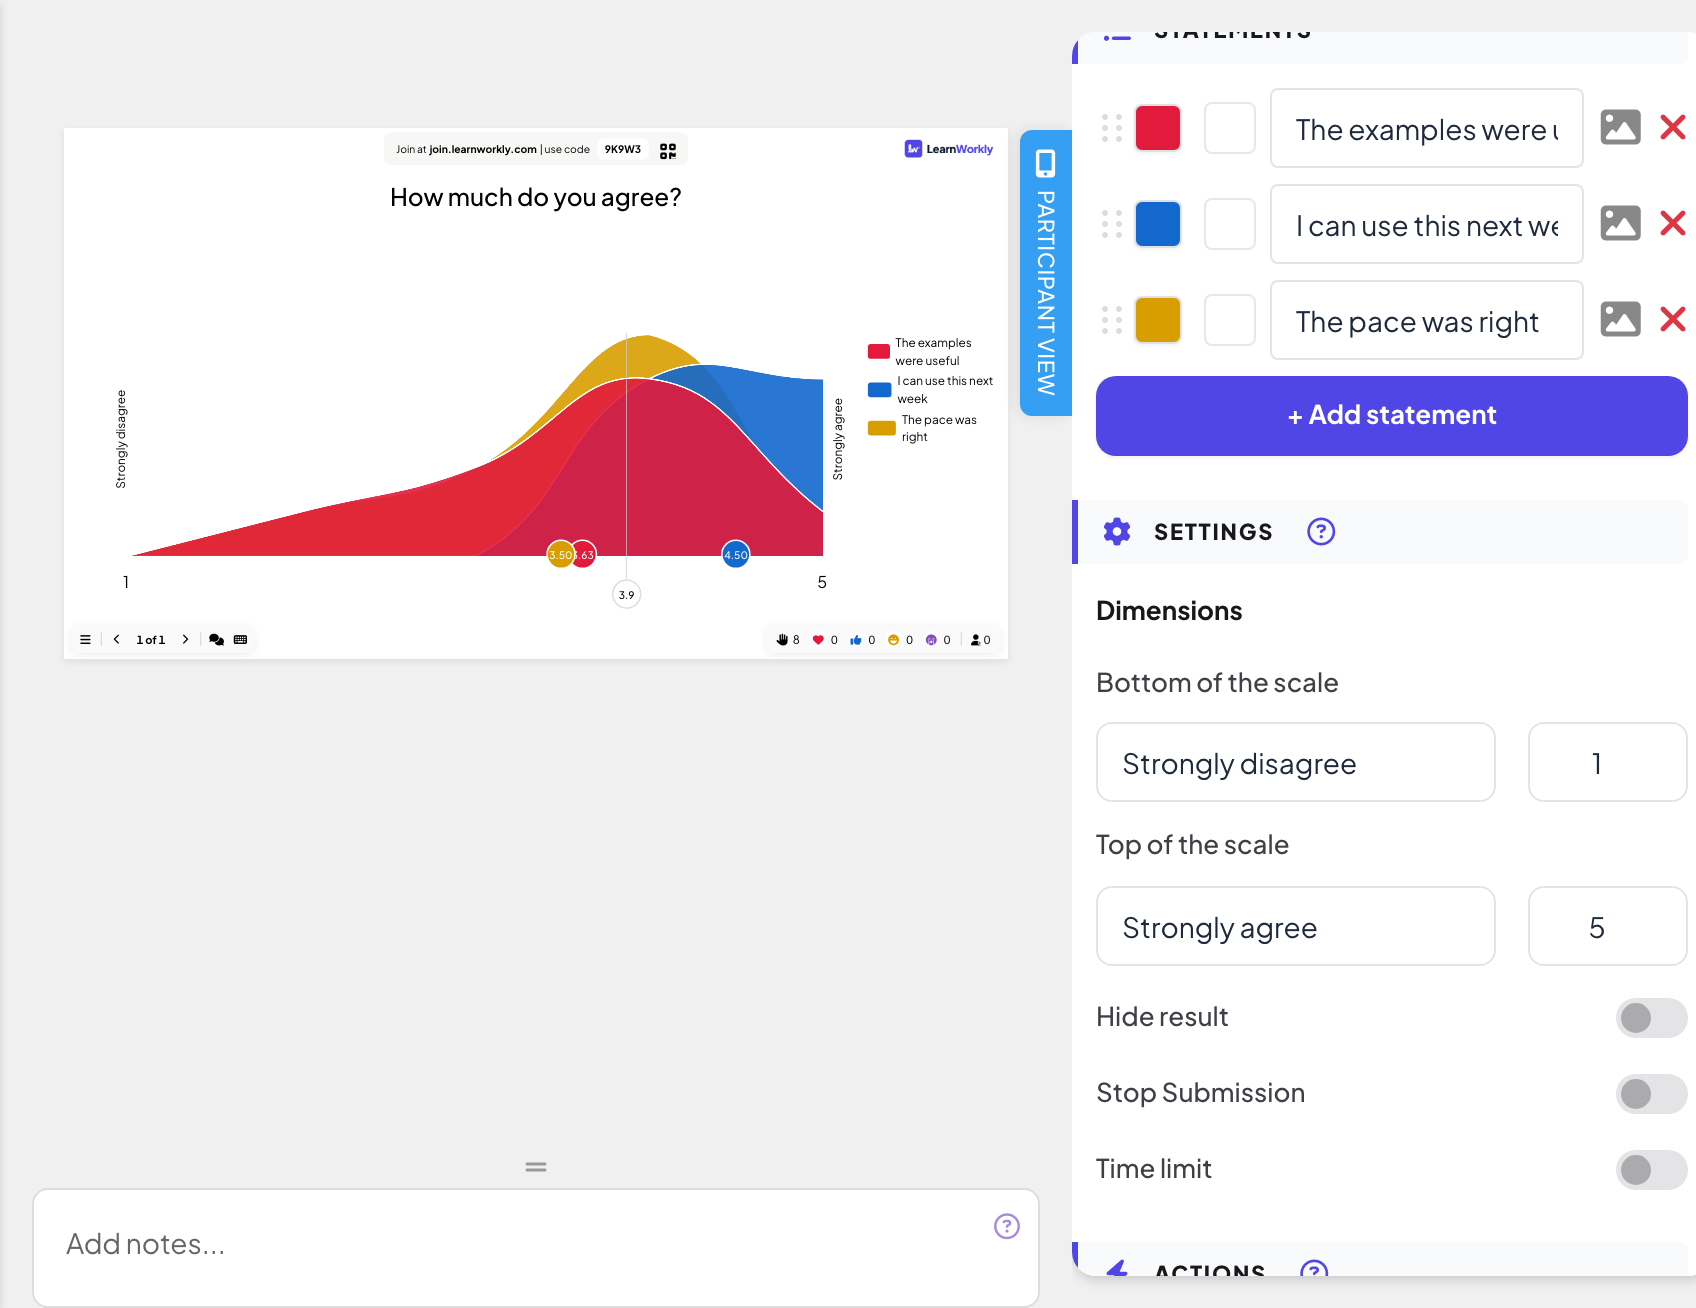
Under Statements, type each statement and click + Add statement for more, up to 9. Each statement has its own colour.
- 4
Define the scale
Under Settings, Dimensions, set Bottom of the scale and Top of the scale: a label (by default "Strongly disagree" and "Strongly agree") and a number for each end, such as 1 and 5.
Run it live
- 1
Present the slide
Click Present. People join at join.learnworkly.com with your code or the QR code, and the slide appears on their phones.
- 2
People rate
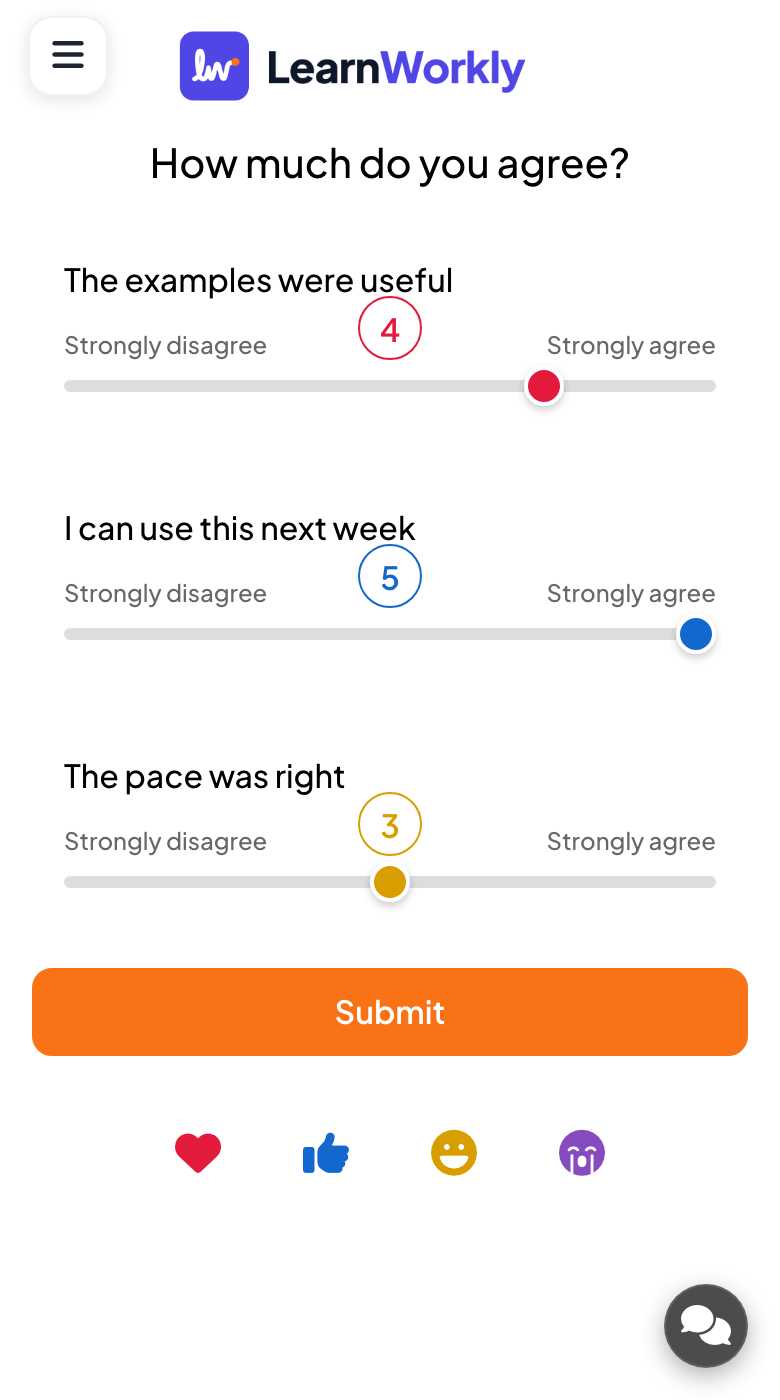
Each statement has a slider on the phone, with your labels at both ends and the chosen number above the handle. Participants move every slider and press Submit.
- 3
Read the chart
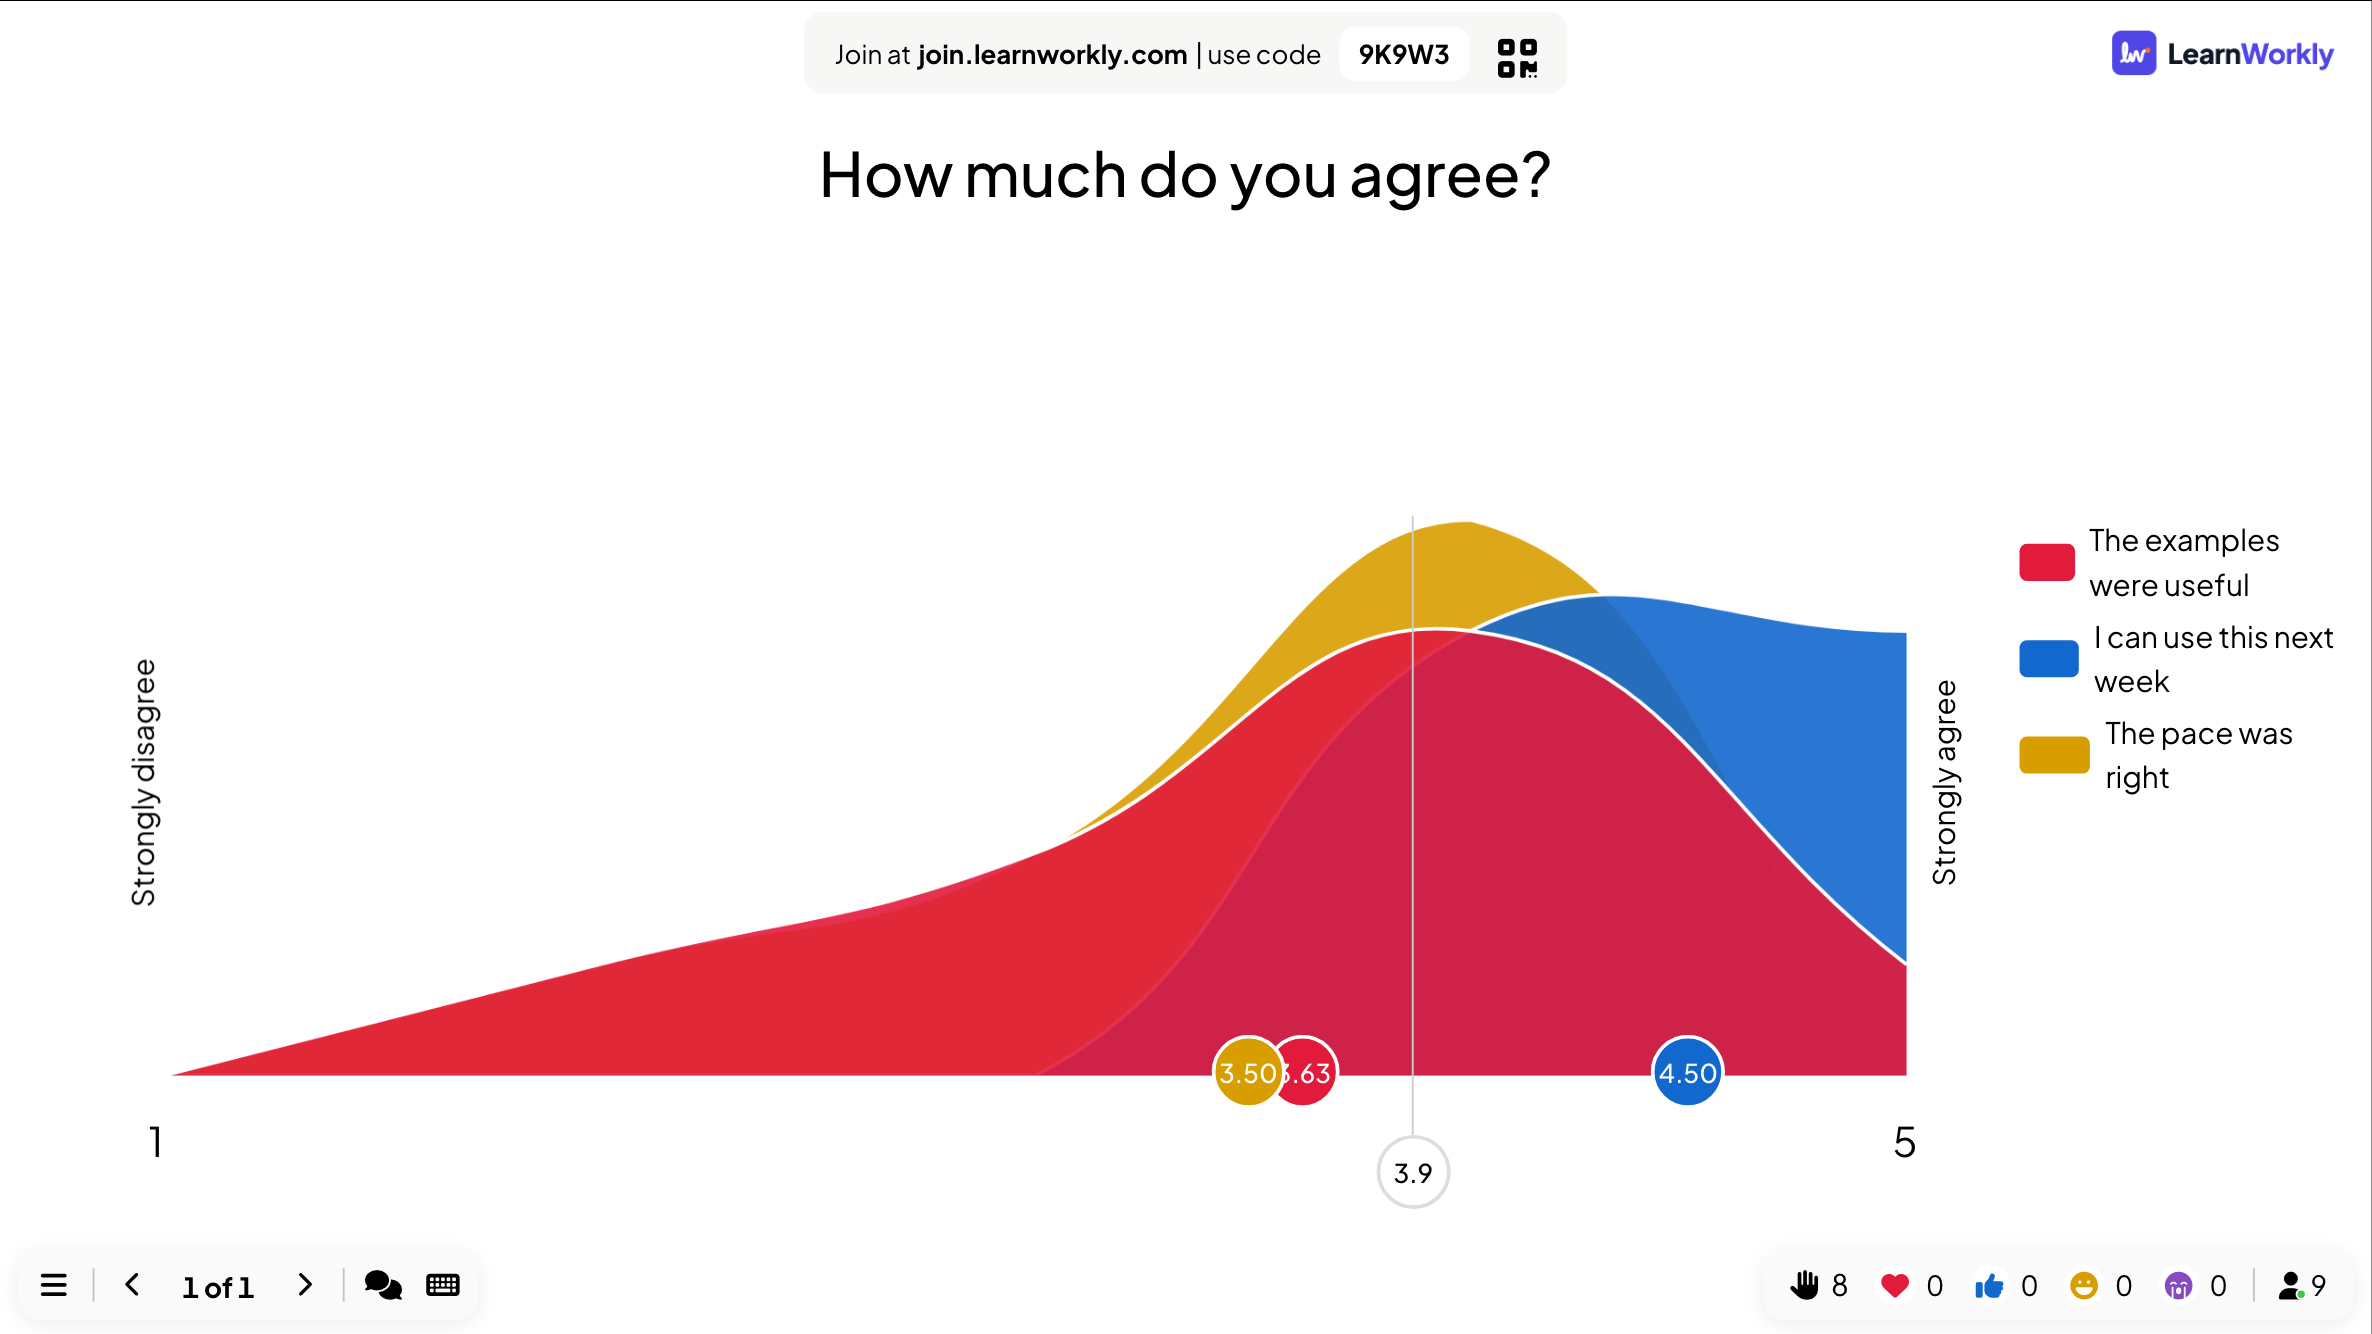
The big screen shows how answers spread for each statement, a dot with the average of each statement, and an overall average line.
Results in the report
After the session, open the presentation’s report (the report button in the editor’s top bar, or Report in your presentation list) and go to Slide Results. See Read the report of a presentation. The report shows the average of each statement as a bar.
Frequently asked questions
Can I use a 1 to 10 scale?
Yes. Set the numbers of Bottom of the scale and Top of the scale to the range you want.
Do people have to move every slider?
No. Each slider starts in the middle of the scale, and a slider nobody touches sends that middle value. Ask people to set every slider before they submit.
Is it anonymous?
The chart shows spreads and averages only, never names.
Last checked against the app on 17 November 2026.
Related articles
- Ranking: put options in order of preferenceParticipants drag options into their order of preference on their phones, and the big screen ranks the options by the combined result of the room.
- 2x2 Grid: plot items on two axesParticipants rate each item on two axes, such as effort and impact, and the big screen plots the average position of every item on a 2x2 grid.
- Response settings for interactive slidesTurn on correct answers, hide results, stop submissions, allow several answers, set a time limit and clear results on polls, word clouds and other slides.